Fifth Edition | December 2022
Download: full report | executive summary | one-page state profiles | data visualizations | dataset
In the United States, K-12 school finance is largely controlled by the states. The inner workings of individual states’ systems are complex, often driven by a grid-work of funding rules and formulas that have evolved over decades of political wrangling, legislation and litigation. In most states, only a small group of people fully understand how billions of public dollars make their annual migration from states to districts to schools and classrooms.
Yet these funding systems have dramatic consequences for millions of public school students. Over the past 10-15 years, there has emerged a growing consensus, supported by high-quality empirical research, that additional funding improves student outcomes (and funding cuts hurt those outcomes), particularly among disadvantaged students. There are, of course, serious and important debates about how education funding should be spent. Yet virtually all effective potential policies and approaches require investment, often substantial investment. Proper funding, in other words, is a necessary (but not sufficient) requirement for improving student outcomes. Understanding, assessing, and performing states’ funding systems is therefore a crucial part of any efforts to bring about such improvement.
In this report, we evaluate the K-12 school finance systems of all 50 states and the District of Columbia. The latest year of data presented pertains to the 2019-20 school year, but we also examine trends in our measures going back 10-15 years.
HOW WE EVALUATE STATES’ SYSTEMS
Most analyses and discussions of school funding focus on how much states (or districts) spend. This is obviously important information, but by itself it is a rather blunt tool for evaluating K-12 finance systems. The more appropriate question is whether that funding is enough. Some districts require more resources than others to achieve a given level of outcomes, due to differences in students served (e.g., poverty), labor costs, and other factors. Simply comparing how much states or districts spend ignores this enormous variation in how much they must spend to meet their students’ needs.
Accordingly, we use a national cost model to calculate adequate funding levels for the vast majority of the nation’s public school districts. We then use these estimates to evaluate each state based on the overall adequacy of funding across all its districts (statewide adequacy) as well as the degree to which high-poverty districts are more or less adequately funded than affluent districts (equal opportunity). Finally, because states vary quite drastically in their ability to raise revenue, we also assess whether states are leveraging their capacity to fund schools by measuring total state and local spending as a percentage of states’ economies (fiscal effort).
These three “core indicators”—effort, statewide adequacy, and equal opportunity—offer a parsimonious overview of whether states’ systems are accomplishing their primary goal of providing adequate and equitable funding for all students, regardless of their backgrounds.
Summary characterizations of each state’s performance on our three core indicators are presented in Table Exec1. But we begin by summarizing our results in terms of 8 major findings about the overall state of K-12 school finance systems in the U.S.
Click on any of the graphs below to enlarge them or display full versions
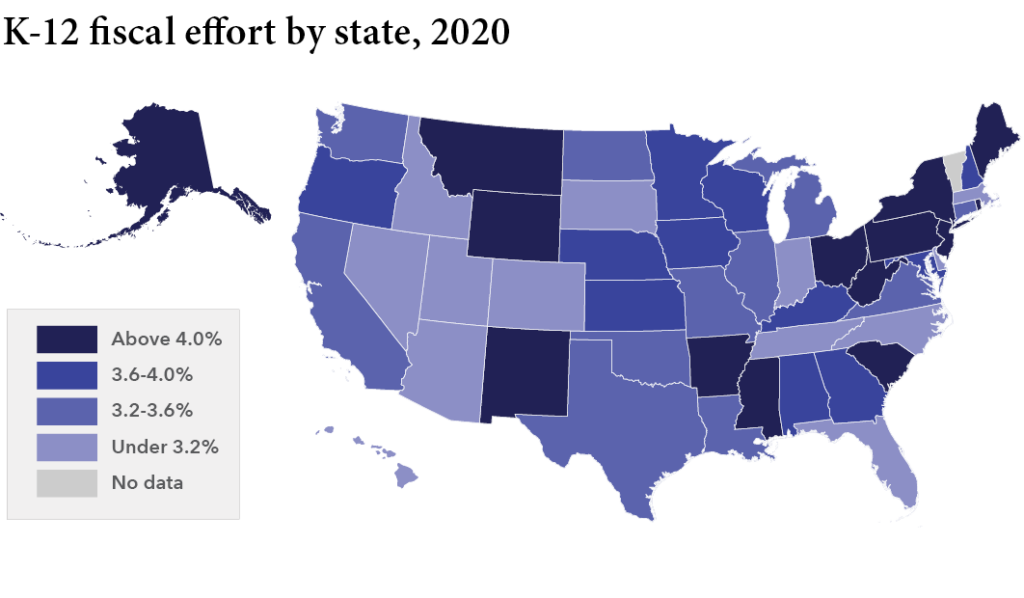
FISCAL EFFORT
How much of each state’s economic capacity goes to K-12 schools?
Fiscal effort (or just “effort”) is total state and local expenditures in each state as a proportion of its gross state product. Effort indicators allow one to assess how much states leverage their ability to raise revenue, and thus to differentiate states that lack the capacity to meet their students’ needs (e.g. smaller economies from which to draw tax revenue) from those that simply refuse to devote sufficient resources to their public schools.
1. STATES DEVOTE WIDELY VARYING SHARES OF THEIR “ECONOMIC PIES” TO THEIR PUBLIC SCHOOLS.
· Effort ranges from roughly 2.5 percent in Arizona and Hawaii to 4.6 percent in New Jersey and Wyoming.
· Low effort states with widely inadequate funding, such as Arizona, Florida, Nevada, and North Carolina, are essentially choosing to underfund their schools, as they have the capacity to raise more revenue.
· In contrast, several states, most notably Arkansas, Mississippi, New Mexico, and South Carolina, also exhibit widespread underfunding but put forth high effort. These states, due to their high poverty and smaller economies, may require new federal aid to meet their students’ needs.
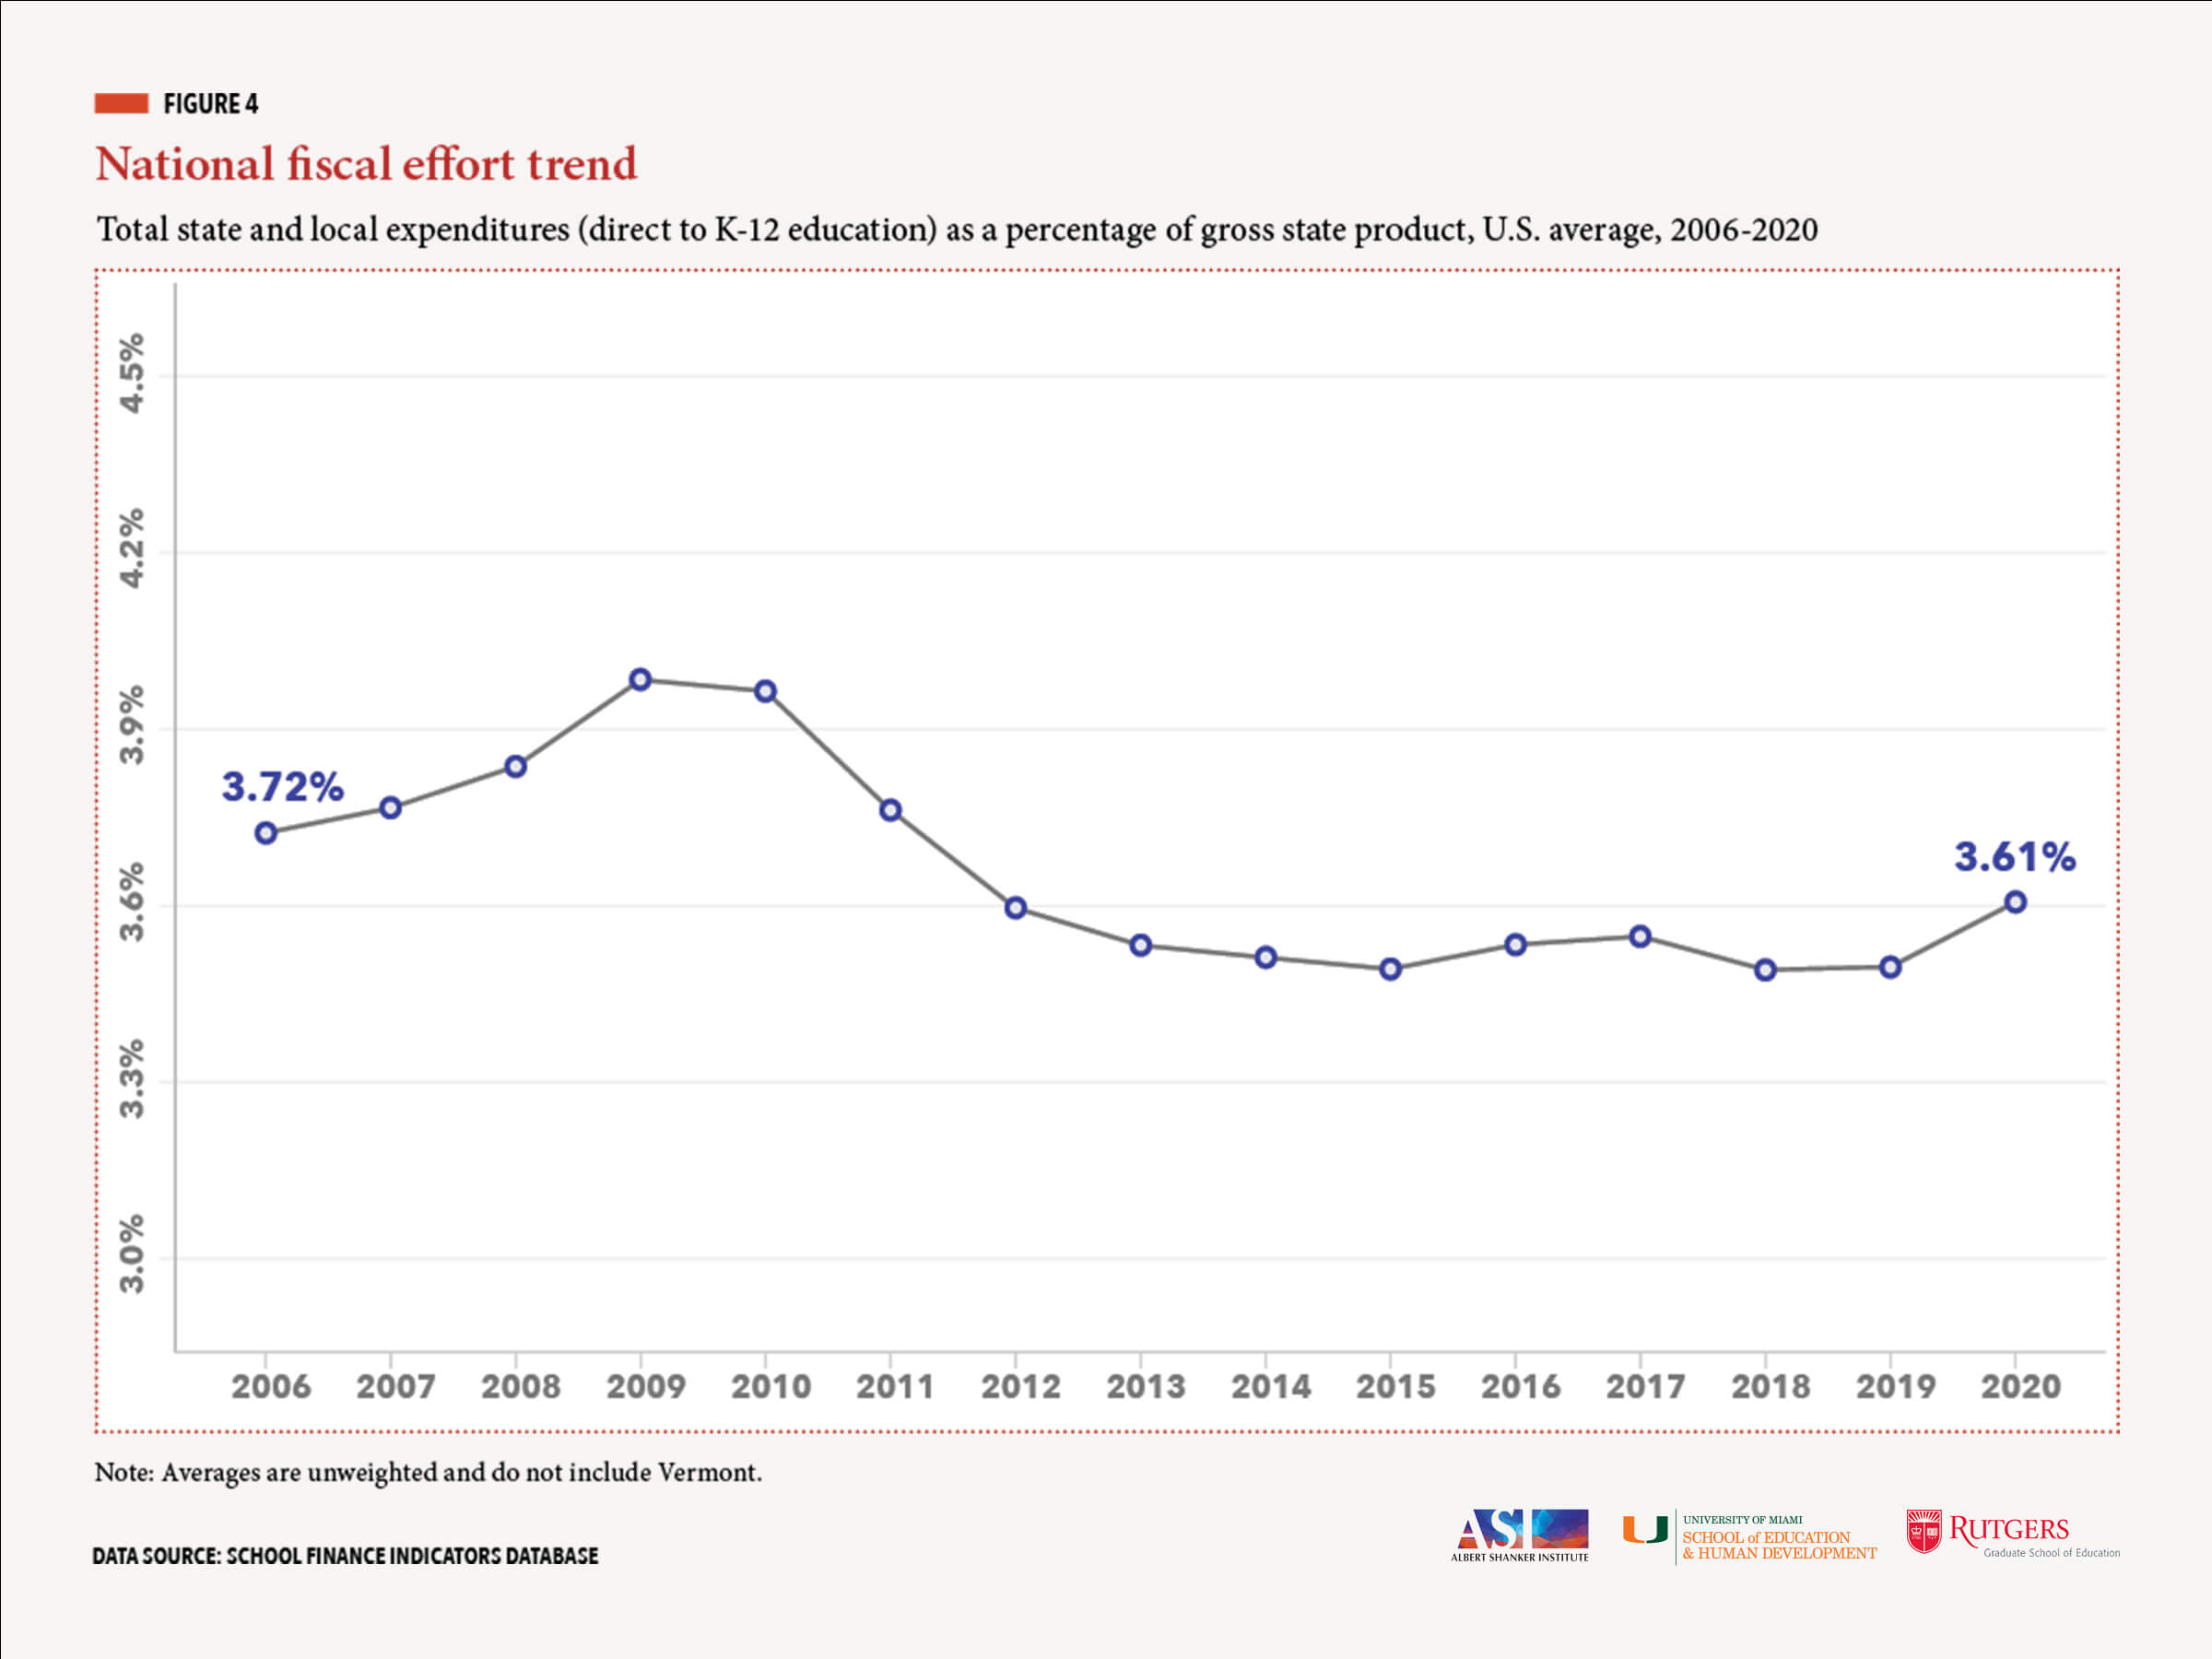
2. THE PERSISTENT DECLINE IN EFFORT SINCE THE 2007-09 RECESSION COST SCHOOLS ALMOST $300 BILLION BETWEEN 2016 AND 2020.
· Average 2016-2020 effort is lower than it was prior to the recession in 39 states. Had all states recovered to their own pre-recession effort levels by 2016, total K-12 funding between 2016 and 2020 would have been $288 billion higher (over 8 percent)
· U.S. average effort increased from 3.5 to 3.6 percent between 2019 and 2020, but this is likely a temporary, “illusory” bump due to the pandemic’s effect on states’ economies in early 2020, rather than to increased K-12 investment.
STATEWIDE
ADEQUACY
How many of a state’s students attend underfunded districts?
Whereas effort measures how hard states work to raise education funds, adequacy addresses whether the amount raised is enough. Our adequacy estimates compare each district’s actual spending to cost model estimates of spending levels required to achieve the (modest) goal of U.S. average test scores. This statewide measure gauges overall adequacy in terms of, for instance, the percentage of each state’s students in districts with inadequate funding.
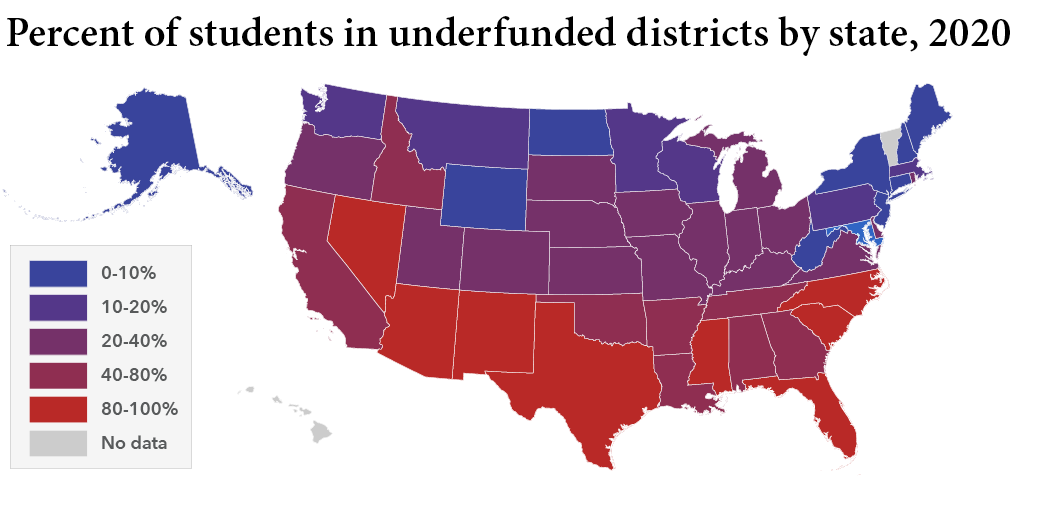
3. DEPENDING ON ONE’S STATE, THE LIKELIHOOD OF ATTENDING SCHOOL IN AN UNDER FUNDED DISTRICT RANGES FROM ZERO TO NEAR CERTAINTY.
· By the modest standard of funding adequate to achieve national average outcomes, the percent of students in districts with below adequate funding varies from zero in Wyoming to roughly 90 percent in states such as Arizona, Florida, Mississippi, Nevada, North Carolina, and Texas.
· If we express statewide adequacy in terms of the percentage difference for the typical student, gaps range from -37 percent (the typical student’s district spends 37 percent below adequate levels) in Mississippi to over +100 percent (actual spending is double required spending) in Wyoming.
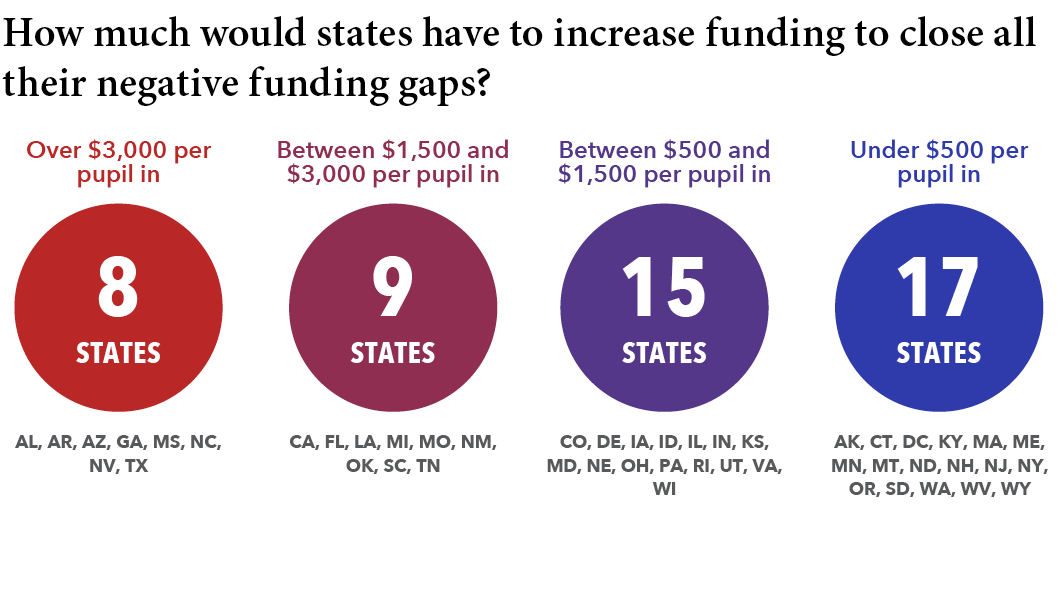
4. CLOSING ALL OF THE NATION’S NEGATIVE FUNDING GAPS—I.E., ACHIEVING UNIVERSAL ADEQUACY—WOULD REQUIRE ALMOST $100 BILLION IN ADDITIONAL FUNDING.
· In order to raise all districts to adequate funding levels without redirecting any money from districts in which funding is already above our (modest) cost targets, total spending would have to increase approximately $95 billion, or 15 percent.
· Virtually every state has districts in which spending is below estimated adequate levels; inadequate funding is a national problem.
· However, roughly 60 percent of the $95 billion in new funding would go to districts in just five states—California, Florida, Georgia, North Carolina, and Texas—which together serve only about one-third of all students.
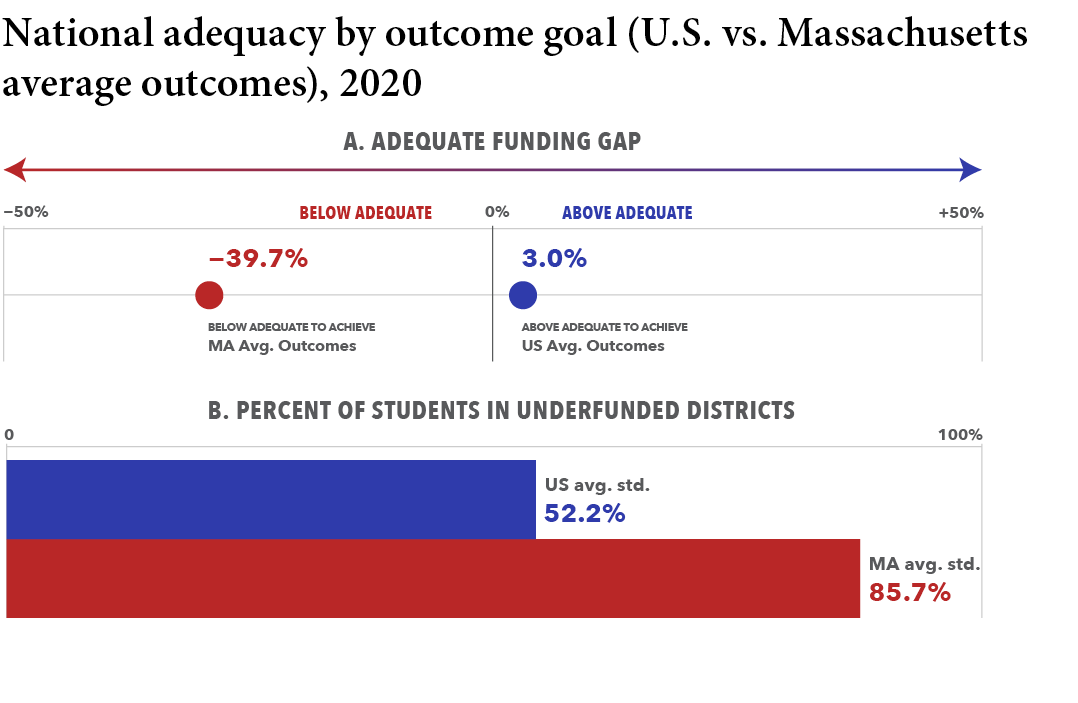
5. INCREASING THE ADEQUACY BENCHMARK TO A MORE AMBITIOUS GOAL DRASTICALLY INCREASES THE COST OF UNIVERSAL ADEQUACY.
· For example, the cost of bringing all districts up to the funding levels necessary to achieve the very ambitious goal of Massachusetts average test scores would require $441 billion in additional funding.
· By this Massachusetts standard, which may be more appropriate for evaluating some states’ funding (e.g., those with higher academic standards), the typical student’s district spends almost 40 percent (-39.7%) below estimated adequate levels, and 86 percent of students attend schools in underfunded districts, including virtually every single student (98-100 percent) in 16 states.
EQUAL
OPPORTUNITY
Are high-poverty districts in a state less adequately funded than its low-poverty districts?
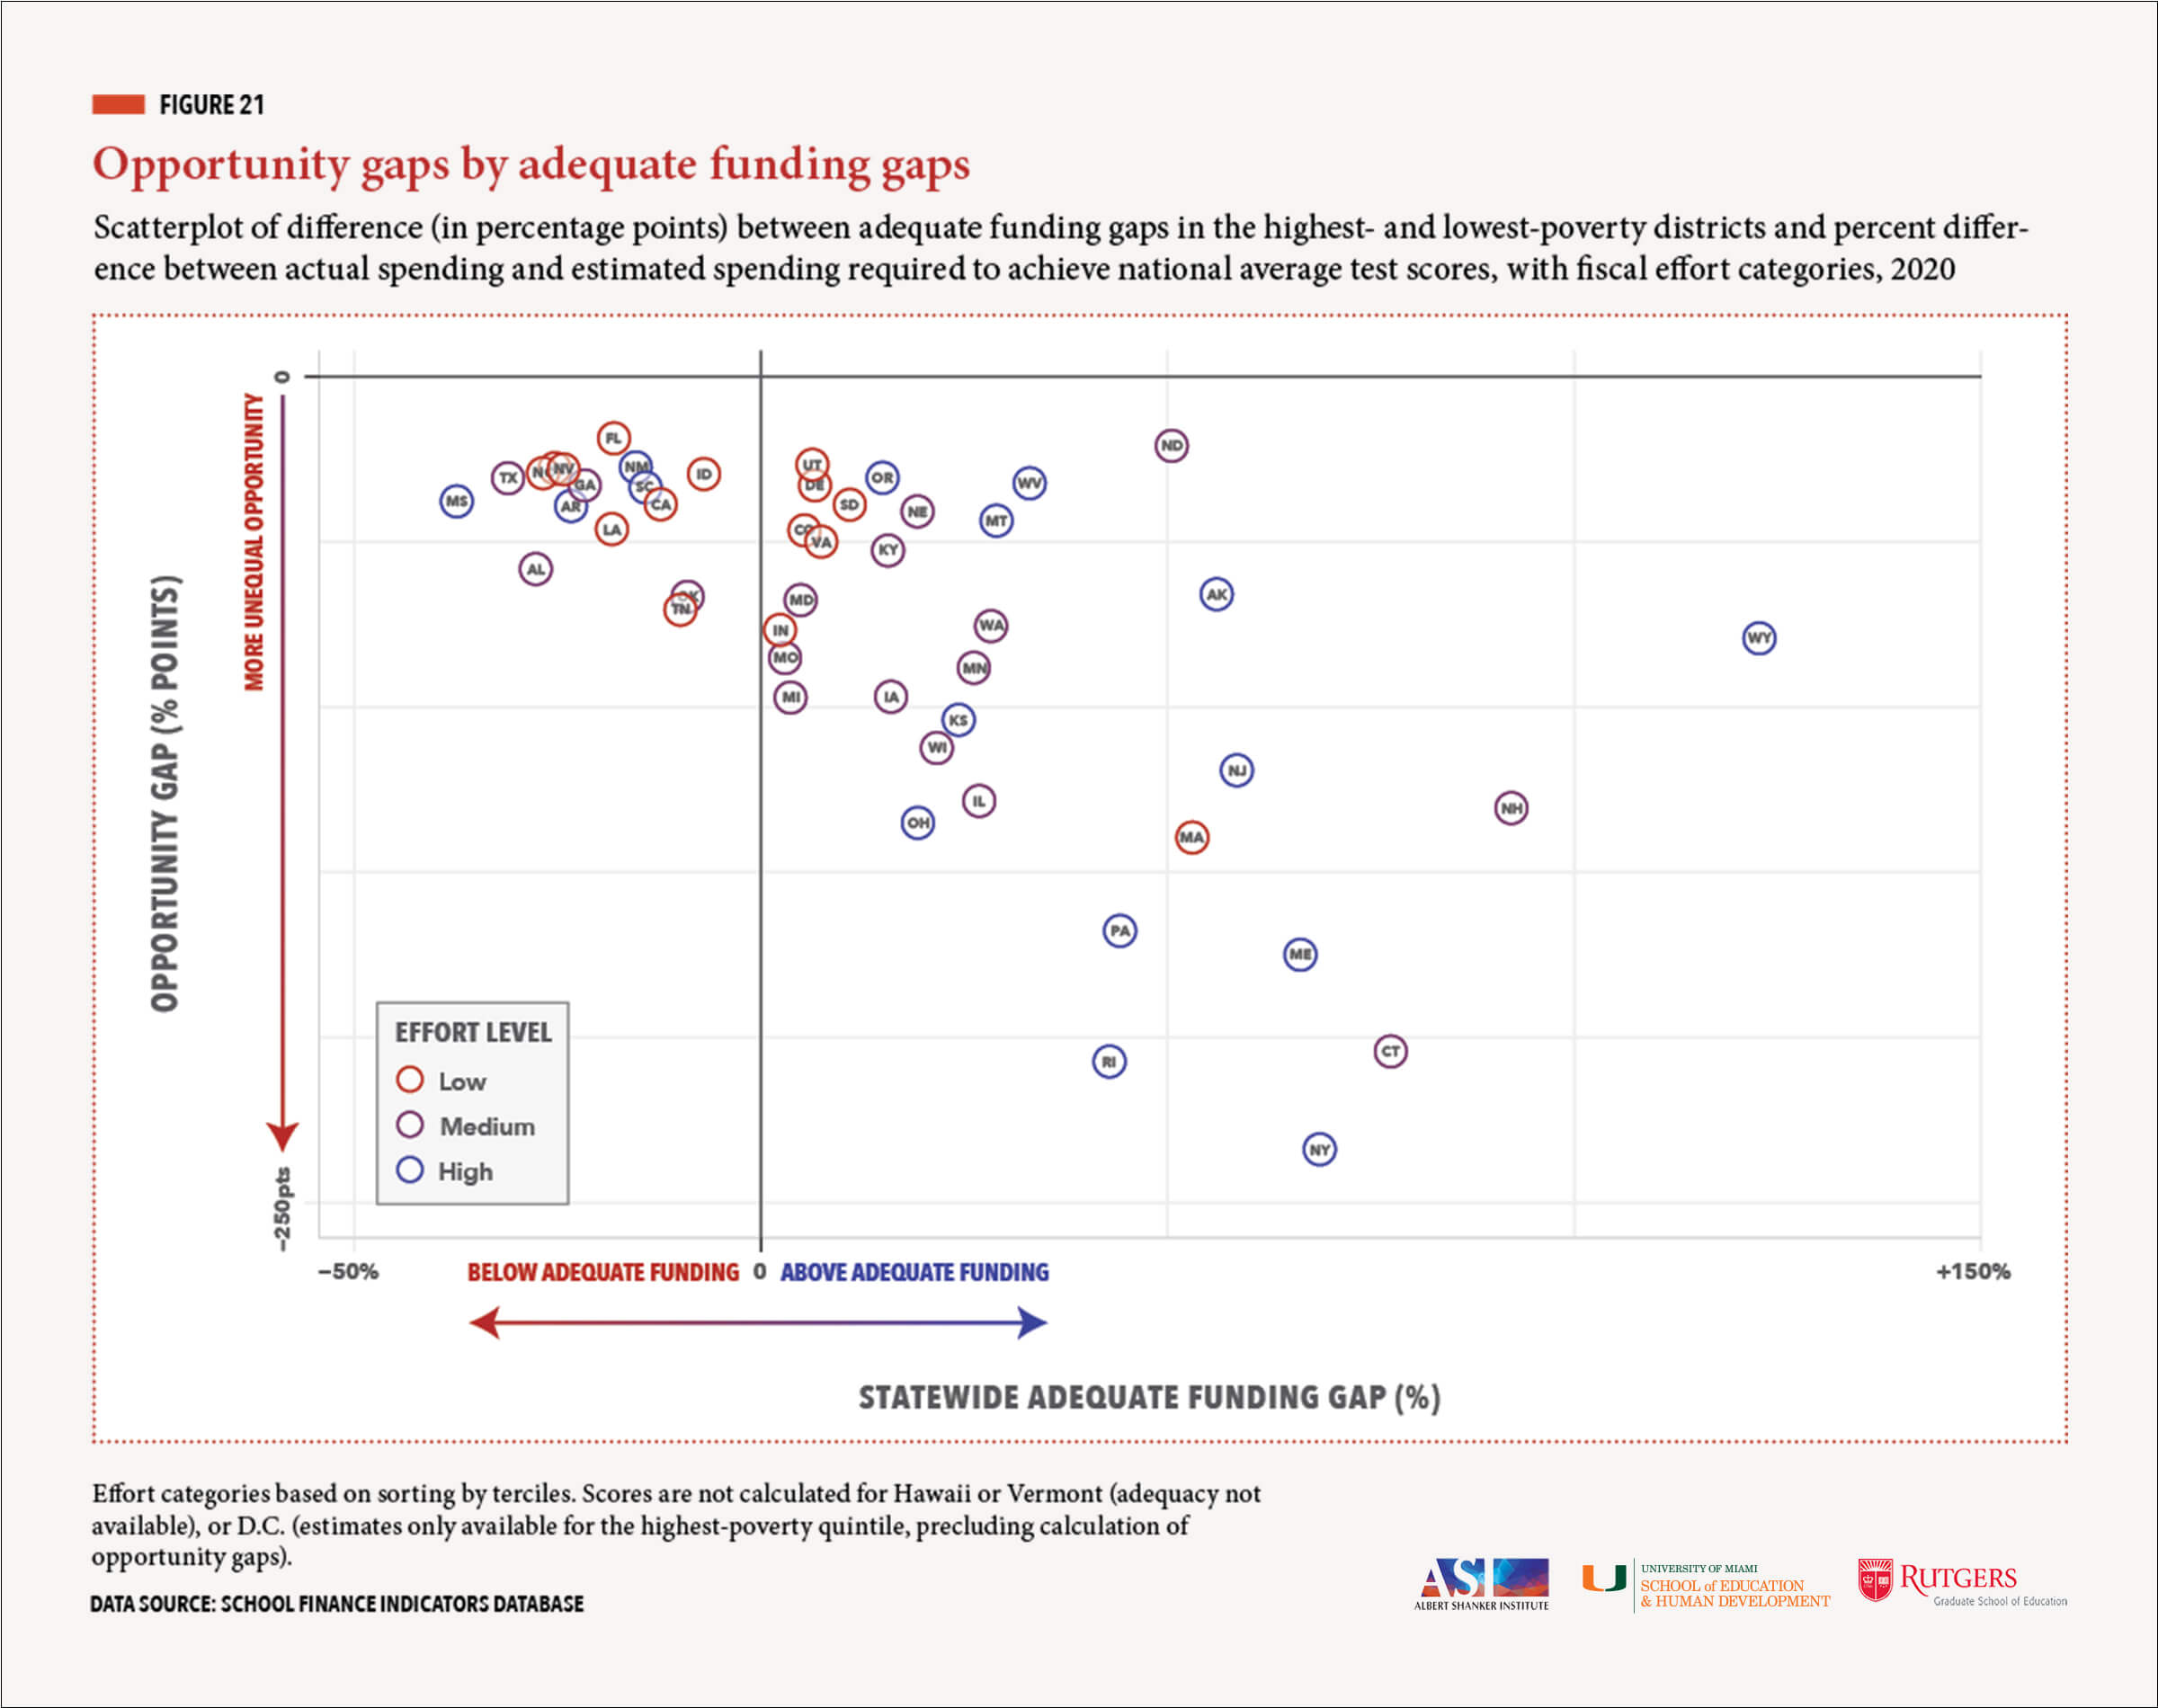
Equal opportunity uses the same district-by-district adequacy estimates as our statewide adequacy measure, but focuses instead on the degree to which adequacy varies between districts in each state—i.e., whether some students have a better chance at achieving a given outcome goal than do others. We measure equal opportunity by comparing adequacy in states’ highest-poverty districts with that in their lowest-poverty districts.
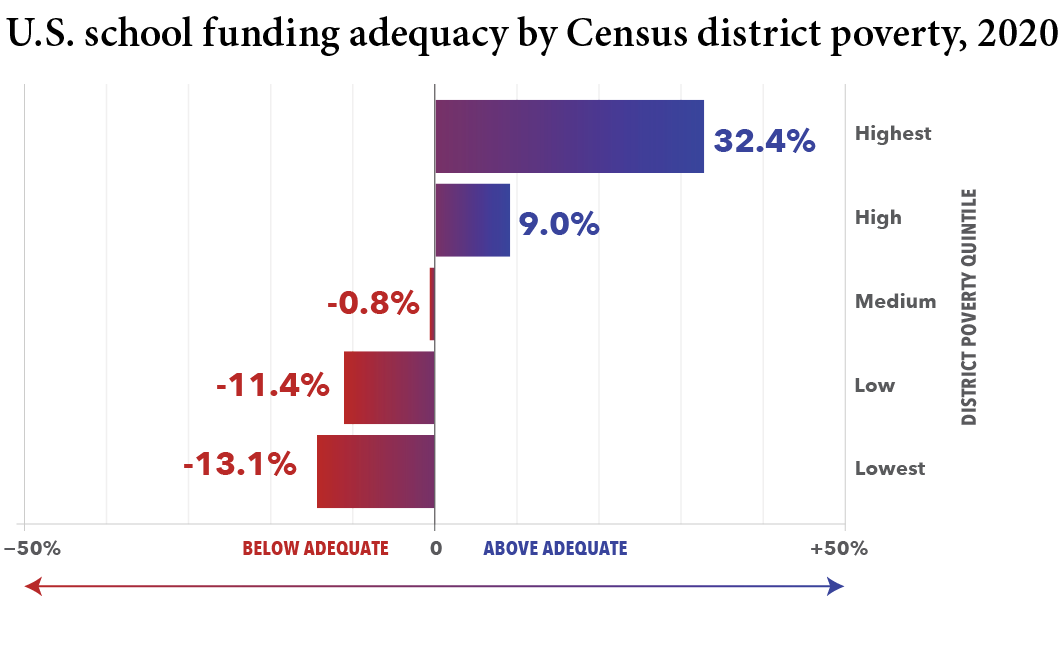
6. UNEQUAL OPPORTUNITY IS A UNIVERSAL FEATURE OF STATE SCHOOL FINANCE SYSTEMS.
· On average, the nation’s highest-poverty districts spend about 13 percent below estimated adequate levels, whereas the most affluent districts spend over 32 percent above adequate levels. This is an average “opportunity gap” of -45 percentage points.
· Lower-poverty districts in the U.S. are essentially funded to achieve better outcomes than are higher-poverty districts.
· These “opportunity gaps” are found in every single state, but they vary drastically in magnitude—from around -20 points in Florida and North Dakota to over -200 points in Connecticut, New York, and Rhode Island.
7. THE MOST ADEQUATELY FUNDED STATES HAVE THE MOST UNEQUAL OPPORTUNITY, AND VICE-VERSA.
· The average negative funding gap in states’ highest-poverty districts improved about 12 percentage points between 2009-19, while the positive gap declined about 15 points for the wealthiest districts.
· This reflects, for instance, the fact that most of the states with comparatively adequate funding are high inequality states with more fragmented district structures. Conversely, more equal opportunity may simply be easier to achieve when spending overall is inadequate, as there isn’t enough funding to generate large gaps.
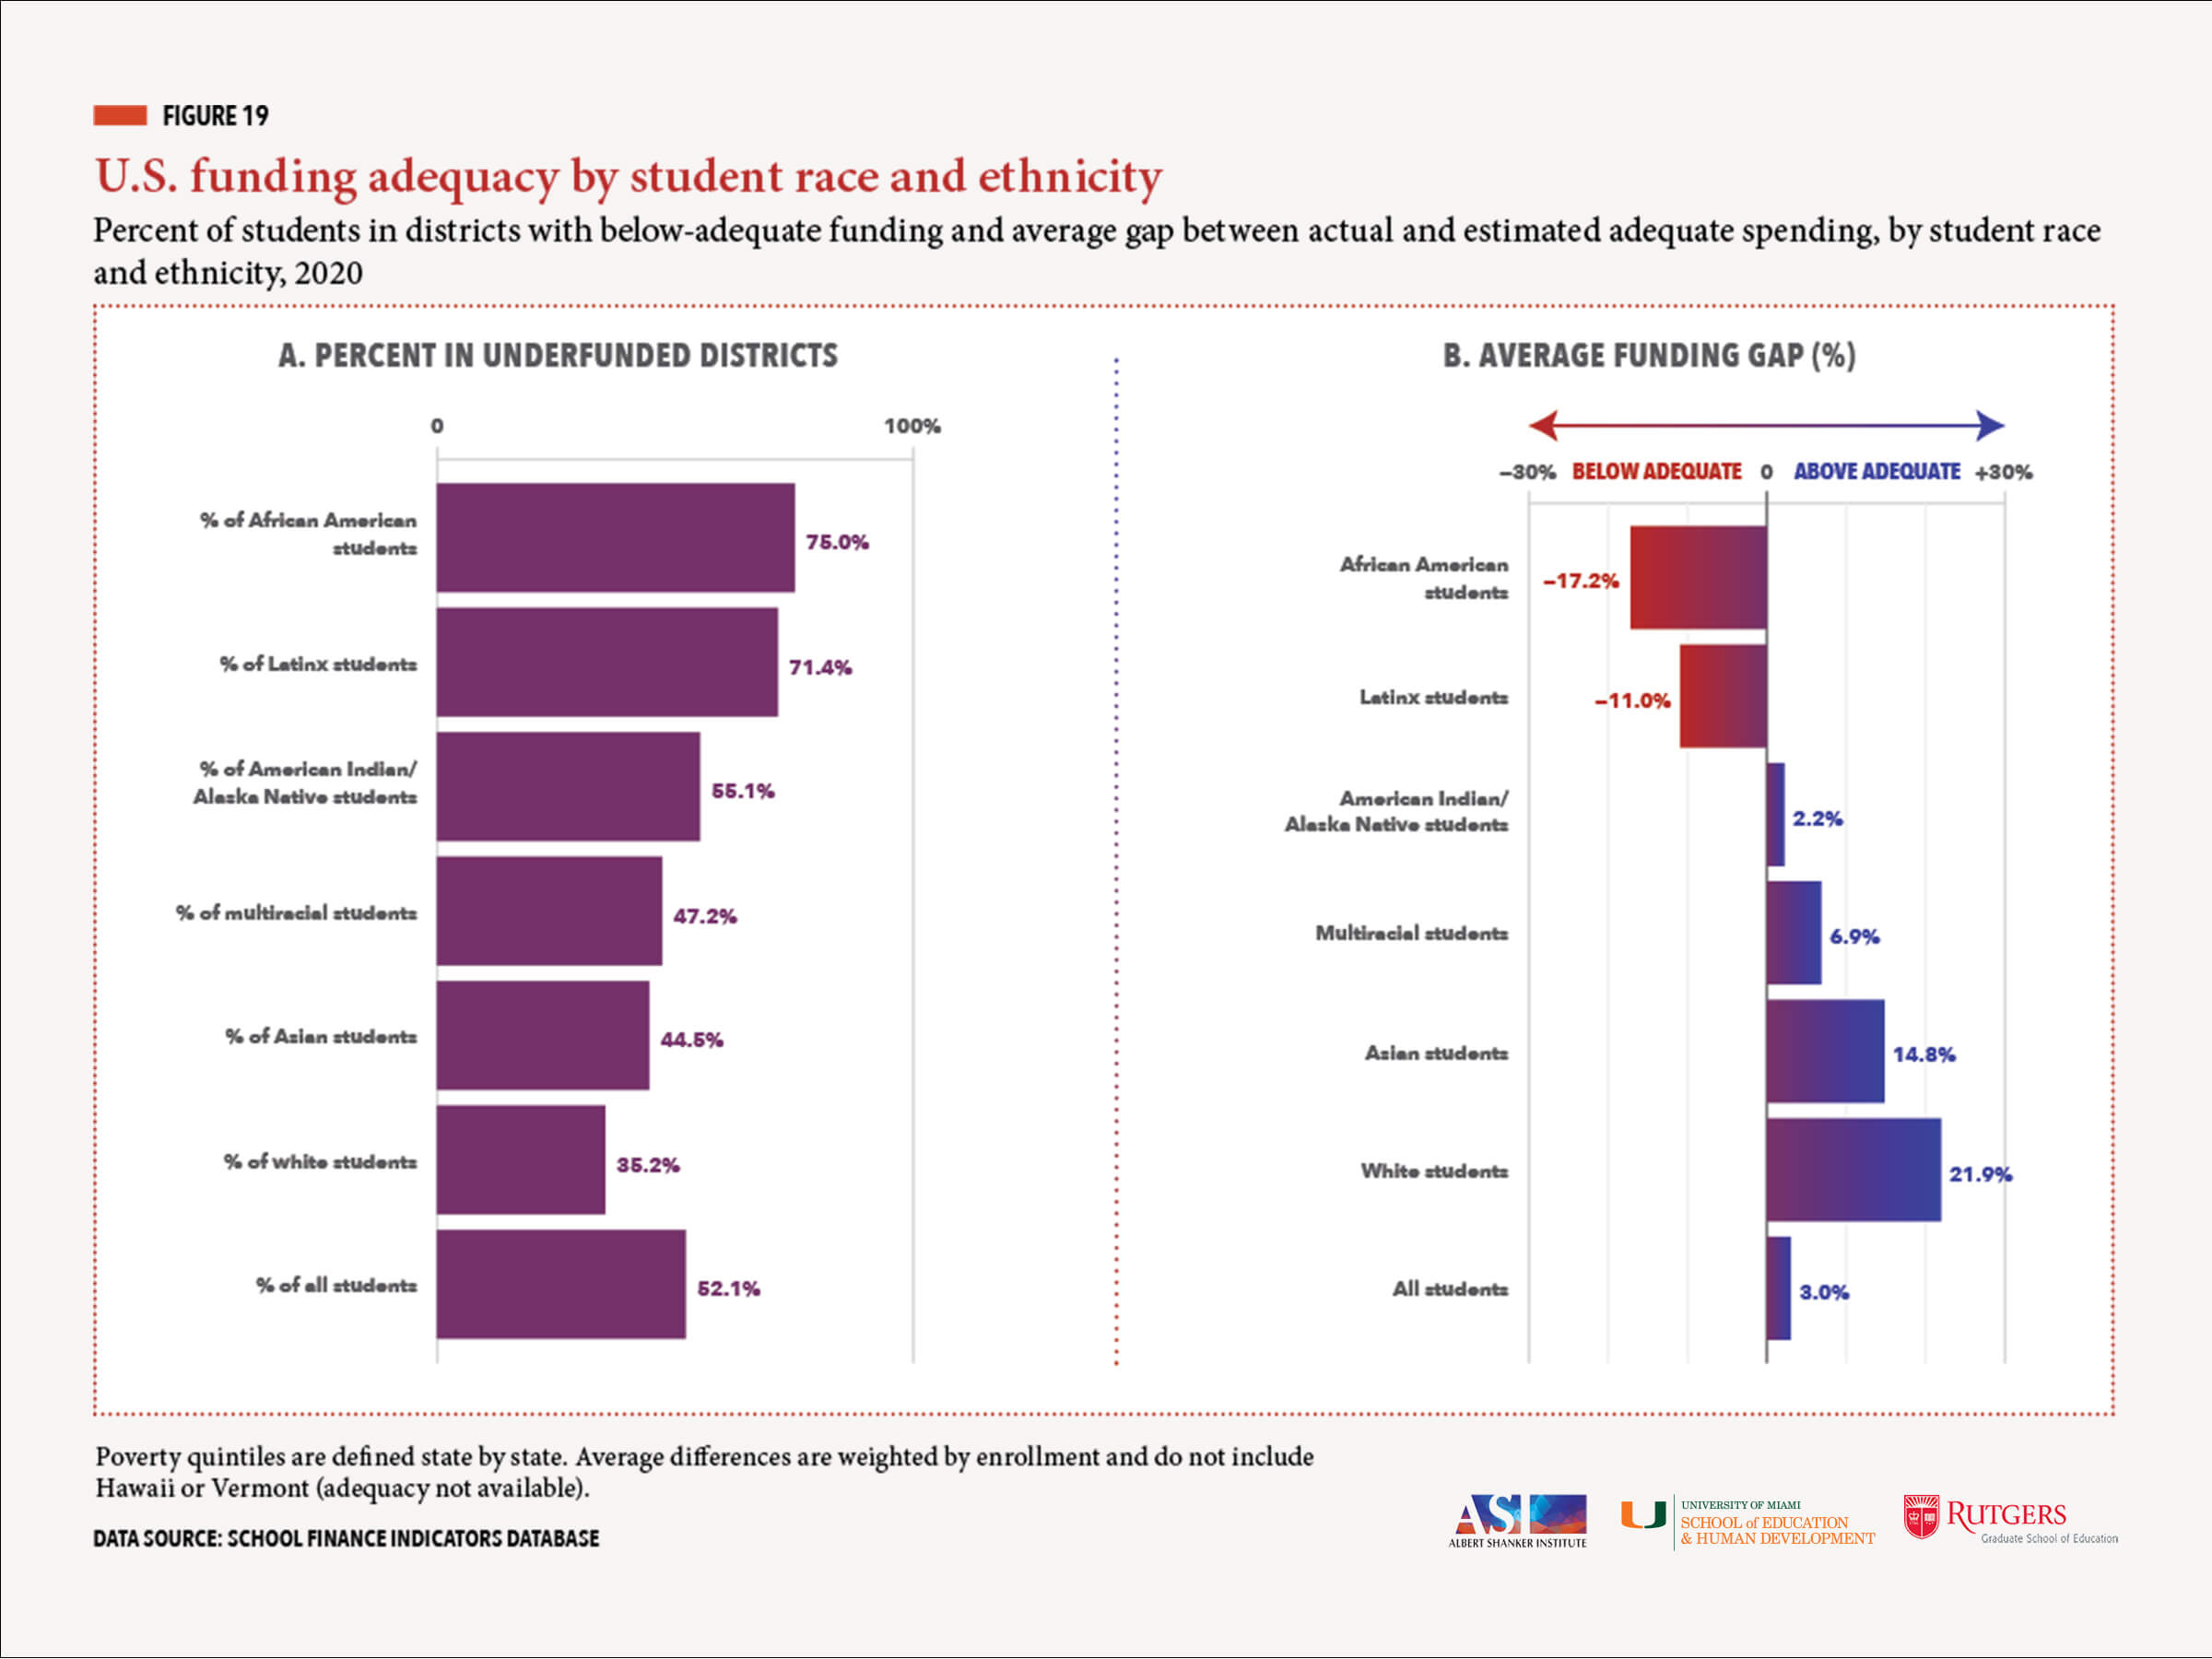
8. AFRICAN AMERICAN AND LATINX STUDENTS ARE TWICE AS LIKELY AS THEIR WHITE PEERS TO BE IN UNDERFUNDED DISTRICTS.
· Roughly 35 percent of the nation’s white students attend schools in underfunded districts, compared with 75 percent of their African American peers and 71 percent of
Latinx students.
· Similarly, the typical white student’s district spends 22 percent above estimated adequate levels, while funding is 17 percent below adequate in the average African American student’s district and 11 percent below in the typical Latinx student’s district.
In an ideal state finance system: 1) all districts’ funding would be adequate to achieve a given (and hopefully desirable) student outcome goal; 2) no districts would have substantially more adequate funding than any others; and 3) the state would devote a large enough share of its “economic pie” in state and local revenue to accomplish these goals.
Unfortunately, this ideal system—or a system that even resembles it—exists only hypothetically. A small handful of states do a reasonably good job of funding their schools adequately, and while educational opportunity is unequal in every single state, there are a few in which it is only moderately so. But there are no states with both adequate funding and even remotely equal opportunity. Making things worse, the typical state devotes a smaller share of its capacity to its schools than at any time in at least 15 years.
Summary performance by state, 2020
| Fiscal Effort | Statewide Adequacy | Equal Opportunity | |
|---|---|---|---|
| AK | high | high | low |
| AL | medium | low | low |
| AR | high | low | low |
| AZ | low | low | medium |
| CA | low | low | low |
| CO | low | medium | low |
| CT | medium | high | severely low |
| DC | low | medium | n/a |
| DE | medium | medium | low |
| FL | low | low | medium |
| GA | medium | low | low |
| HI | low | n/a | n/a |
| IA | medium | medium | severely low |
| ID | low | low | medium |
| IL | medium | medium | severely low |
| IN | low | medium | severely low |
| KS | high | medium | severely low |
| KY | medium | medium | low |
| LA | low | low | low |
| MA | low | high | severely low |
| MD | medium | medium | low |
| ME | high | high | severely low |
| MI | medium | medium | severely low |
| MN | medium | medium | severely low |
| MO | medium | medium | severely low |
| MS | high | low | low |
| MT | high | medium | low |
| NC | low | low | medium |
| ND | medium | high | medium |
| NE | medium | medium | low |
| NH | medium | high | severely low |
| NJ | high | high | severely low |
| NM | high | low | medium |
| NV | low | low | medium |
| NY | high | high | severely low |
| OH | high | medium | severely low |
| OK | medium | low | low |
| OR | high | medium | low |
| PA | high | medium | severely low |
| RI | high | medium | severely low |
| SC | high | low | low |
| SD | low | medium | low |
| TN | low | low | low |
| TX | medium | low | low |
| UT | low | medium | medium |
| VA | low | medium | low |
| VT | n/a | n/a | n/a |
| WA | medium | medium | severely low |
| WI | medium | medium | severely low |
| WV | high | medium | low |
| WY | high | high | severely low |
In ExecTable 1, we present a simplified summary of each state’s results on effort, statewide adequacy, and equal opportunity. For more detailed state-by-state results, download the one-page profiles for each state by clicking on the state abbreviation in the table.
To be clear, these outcomes—statewide adequacy in particular—are influenced in part by factors that states do not control. For instance, there are several states, such as Arkansas, Mississippi, New Mexico, and South Carolina, which, despite their high effort levels, do not achieve widely adequate funding due to unusually high costs (e.g., high poverty) and low capacity (small economies from which to draw revenue).
In general, however, the performance of states’ K-12 finance systems, positive and negative, are due largely to deliberate policy choices on the part of state legislatures. Perhaps the most egregious examples are states such as Arizona, California, Florida, Idaho, Louisiana, Nevada, North Carolina, and Tennessee, in which both effort and adequacy are low; these states are effectively choosing to underfund large swaths of students. Yet, even in states where adequacy is generally (and laudably) high, many thousands of (disproportionately lower-income) students still fall through the cracks, and educational opportunity is typically severely unequal. These states are in many respects inequality factories, reproducing unequal student outcomes, year after year, by design.
The upside of the conclusion that performance is mostly
within states’ control is that systems can be improved by better policy. Moreover, when such improvement is done properly—by targeting new revenue at underfunded districts—effort, adequacy, and equal opportunity can be increased simultaneously.
RECOMMENDATIONS
This is a national report and states’ systems vary dramatically “under the hood,” which means our recommendations are necessarily general. Yet there are basic, research-backed principles that should guide the design and improvement of all states’ systems, and our results suggest that the vast majority of states (in some respects all states) are violating these principles. Here we offer a summary of recommendations embodying these tenets (more details on each are available in the body of the report):
Better targeting of funding (especially state aid). The backbone of any state finance system is its funding targets—i.e., reasonable calculations of how much funding each district needs to achieve a common desired outcome goal, given its student population and other contextual factors. If funding targets are not determined properly and rigorously, funding may appear adequate and equitable when it is not. As a first step, all states should “audit” their funding targets by comparing them with estimates from rigorous, outcome-based analyses (e.g., cost models) that account for student and district characteristics that influence costs. Once targets are in place, states should then allocate state aid such that all districts have what they need, minus a reasonable local contribution (based on the capacity of each district to produce local revenue).
Increase funding to meet student needs where such funding is inadequate. Note that the point here is not simply to increase funding. It is, rather, to ensure that funding is commensurate with costs/need. In states where funding is widely inadequate, this might include a substantial increase in local revenue from districts where such revenue is lower than would be expected based on capacity. In most states, however, the key is increasing state revenue (e.g., from state sales and income taxes, and/or from expanding tax bases by, for instance, state taxation of non-residential commercial property). And raising new revenue is particularly important in states where effort is medium or low (i.e., where there is capacity to boost investment). Were all states simply to return to their own pre-recession effort levels, this could make a large dent in the nation’s adequate funding gaps.
Distribute federal K-12 aid based on both need and effort. The unfortunate truth is that many states with widely inadequate funding have the economic capacity to address this issue by increasing K-12 revenue, whereas other states put forth relatively strong effort, but their costs are so high (e.g., high poverty student populations) and/or their economies are so small that they cannot meet their students’ needs. For these latter states, federal education aid can serve as a vital bridge to more adequate and equitable funding. We recommend supplemental federal funds be targeted at districts with below adequate funding in states that are either paying their “fair shares” in state and local revenue (i.e., a reasonable minimum effort level) or demonstrate sufficient progress toward meeting this requirement.
Enhance federal monitoring of school funding adequacy, equity, and efficiency. We propose that the U.S. Department of Education establish a national effort to analyze the adequacy and equity of states’ systems, and provide guidance to states as to how they might improve their systems. This would include estimation and publication of measures such as wage adjustment indices and compilations of nationally-normed outcome measures, annual estimates from cost models such as the one used in this report, and periodic (e.g., five-year) evaluations of adequacy and equity in states’ finance systems. It should also include the evaluation of the efficiency of state and local spending, as well as funding of evaluations of specific policies and practices on which new funding might be spent.
Our findings as a whole highlight the enormous heterogeneity of school funding, both within and between states. And, to reiterate, the situation is not uniformly bad. There are, in fact, a few states in which resources are generally adequate (if not allocated in a manner that fosters equal opportunity). And there are relatively few that perform poorly on all three of our core measures. Such diversity is no accident. So long as school finance is primarily in the hands of states, the structure and performance of systems is likely to vary substantially between those states.
The upside of this heterogeneity is that it has allowed researchers to study how different systems produce different outcomes and, as a result, we generally know what a good system looks like. Our framework for evaluating states is based on these principles. It is our hope (and intention) that the data presented in this report will inform school finance debates in the U.S., and help to guide legislators toward improving their states’ systems.
Read the full report
Read the executive summary
View individual state finance profiles
Download the full dataset or use online data visualizations
Authors: Bruce D. Baker (University of Miami); Matthew Di Carlo (Albert Shanker Institute); Mark Weber (Rutgers University)
Latest News
 SIXTH EDITION OF OUR ANNUAL REPORT AND OTHER RESOURCES
January 2024: Read our annual report summarizing the national results, download your state’s one-page profile, view results using our online data visualizations, or download the full dataset.
Latest Annual Report
 The Adequacy and Fairness of State School Finance Systems (sixth edition)
The sixth edition of our annual report presenting findings on effort, statewide adequacy, and equal opportunity in state school finance systems. Published January 2024.
Latest Research Briefs
 State School Finance System Profiles (2020-21 school year)
One-page profiles summarizing the key results on effort, statewide adequacy, and equal opportunity for all 50 states and D.C. View your state’s profile. Published January 2024.


Copyright © 2022-2023 Albert Shanker Institute | All Rights Reserved