Seventh Edition | March 2025
RESOURCES: read full report | view state profiles | use data visualizations | download full dataset
EXECUTIVE SUMMARY
In the United States, K-12 school finance is largely controlled by the states. Every year, hundreds of billions of dollars in public funds are distributed based on 51 different configurations of formulas, rules, and regulations to over 13,000 districts that vary in terms of the students they serve, their ability to raise revenue locally, and many other characteristics.
In this seventh edition of our annual report, we evaluate the K-12 school finance systems of all 50 states and the District of Columbia. The latest year of data we present is the 2021-22 school year.
Good school finance systems compensate for factors states cannot control (e.g., student poverty, labor costs) using levers that they can control (e.g., driving funding to districts that need it most). We have devised a framework that evaluates states based largely on how well they accomplish this balance. We assess each state’s funding while accounting directly for the students and communities served by its public schools.
This is important because how much a given district or state spends on its schools, by itself, is a rather blunt measure of how well those schools are funded. For example, high-poverty districts require more resources to achieve a given outcome goal—e.g., a particular average score on a standardized test—than do more affluent districts. In other words, education costs varydepending on student populations, labor markets, and other factors. That is a fundamental principle of school finance. Simply comparing how much states or districts spend ignores this enormous variation in how much they must spend to meet their students’ needs.
The key question, then, is not just how much states and districts spend but whether it’s enough—is funding adequate for students from all backgrounds to achieve common outcome goals?
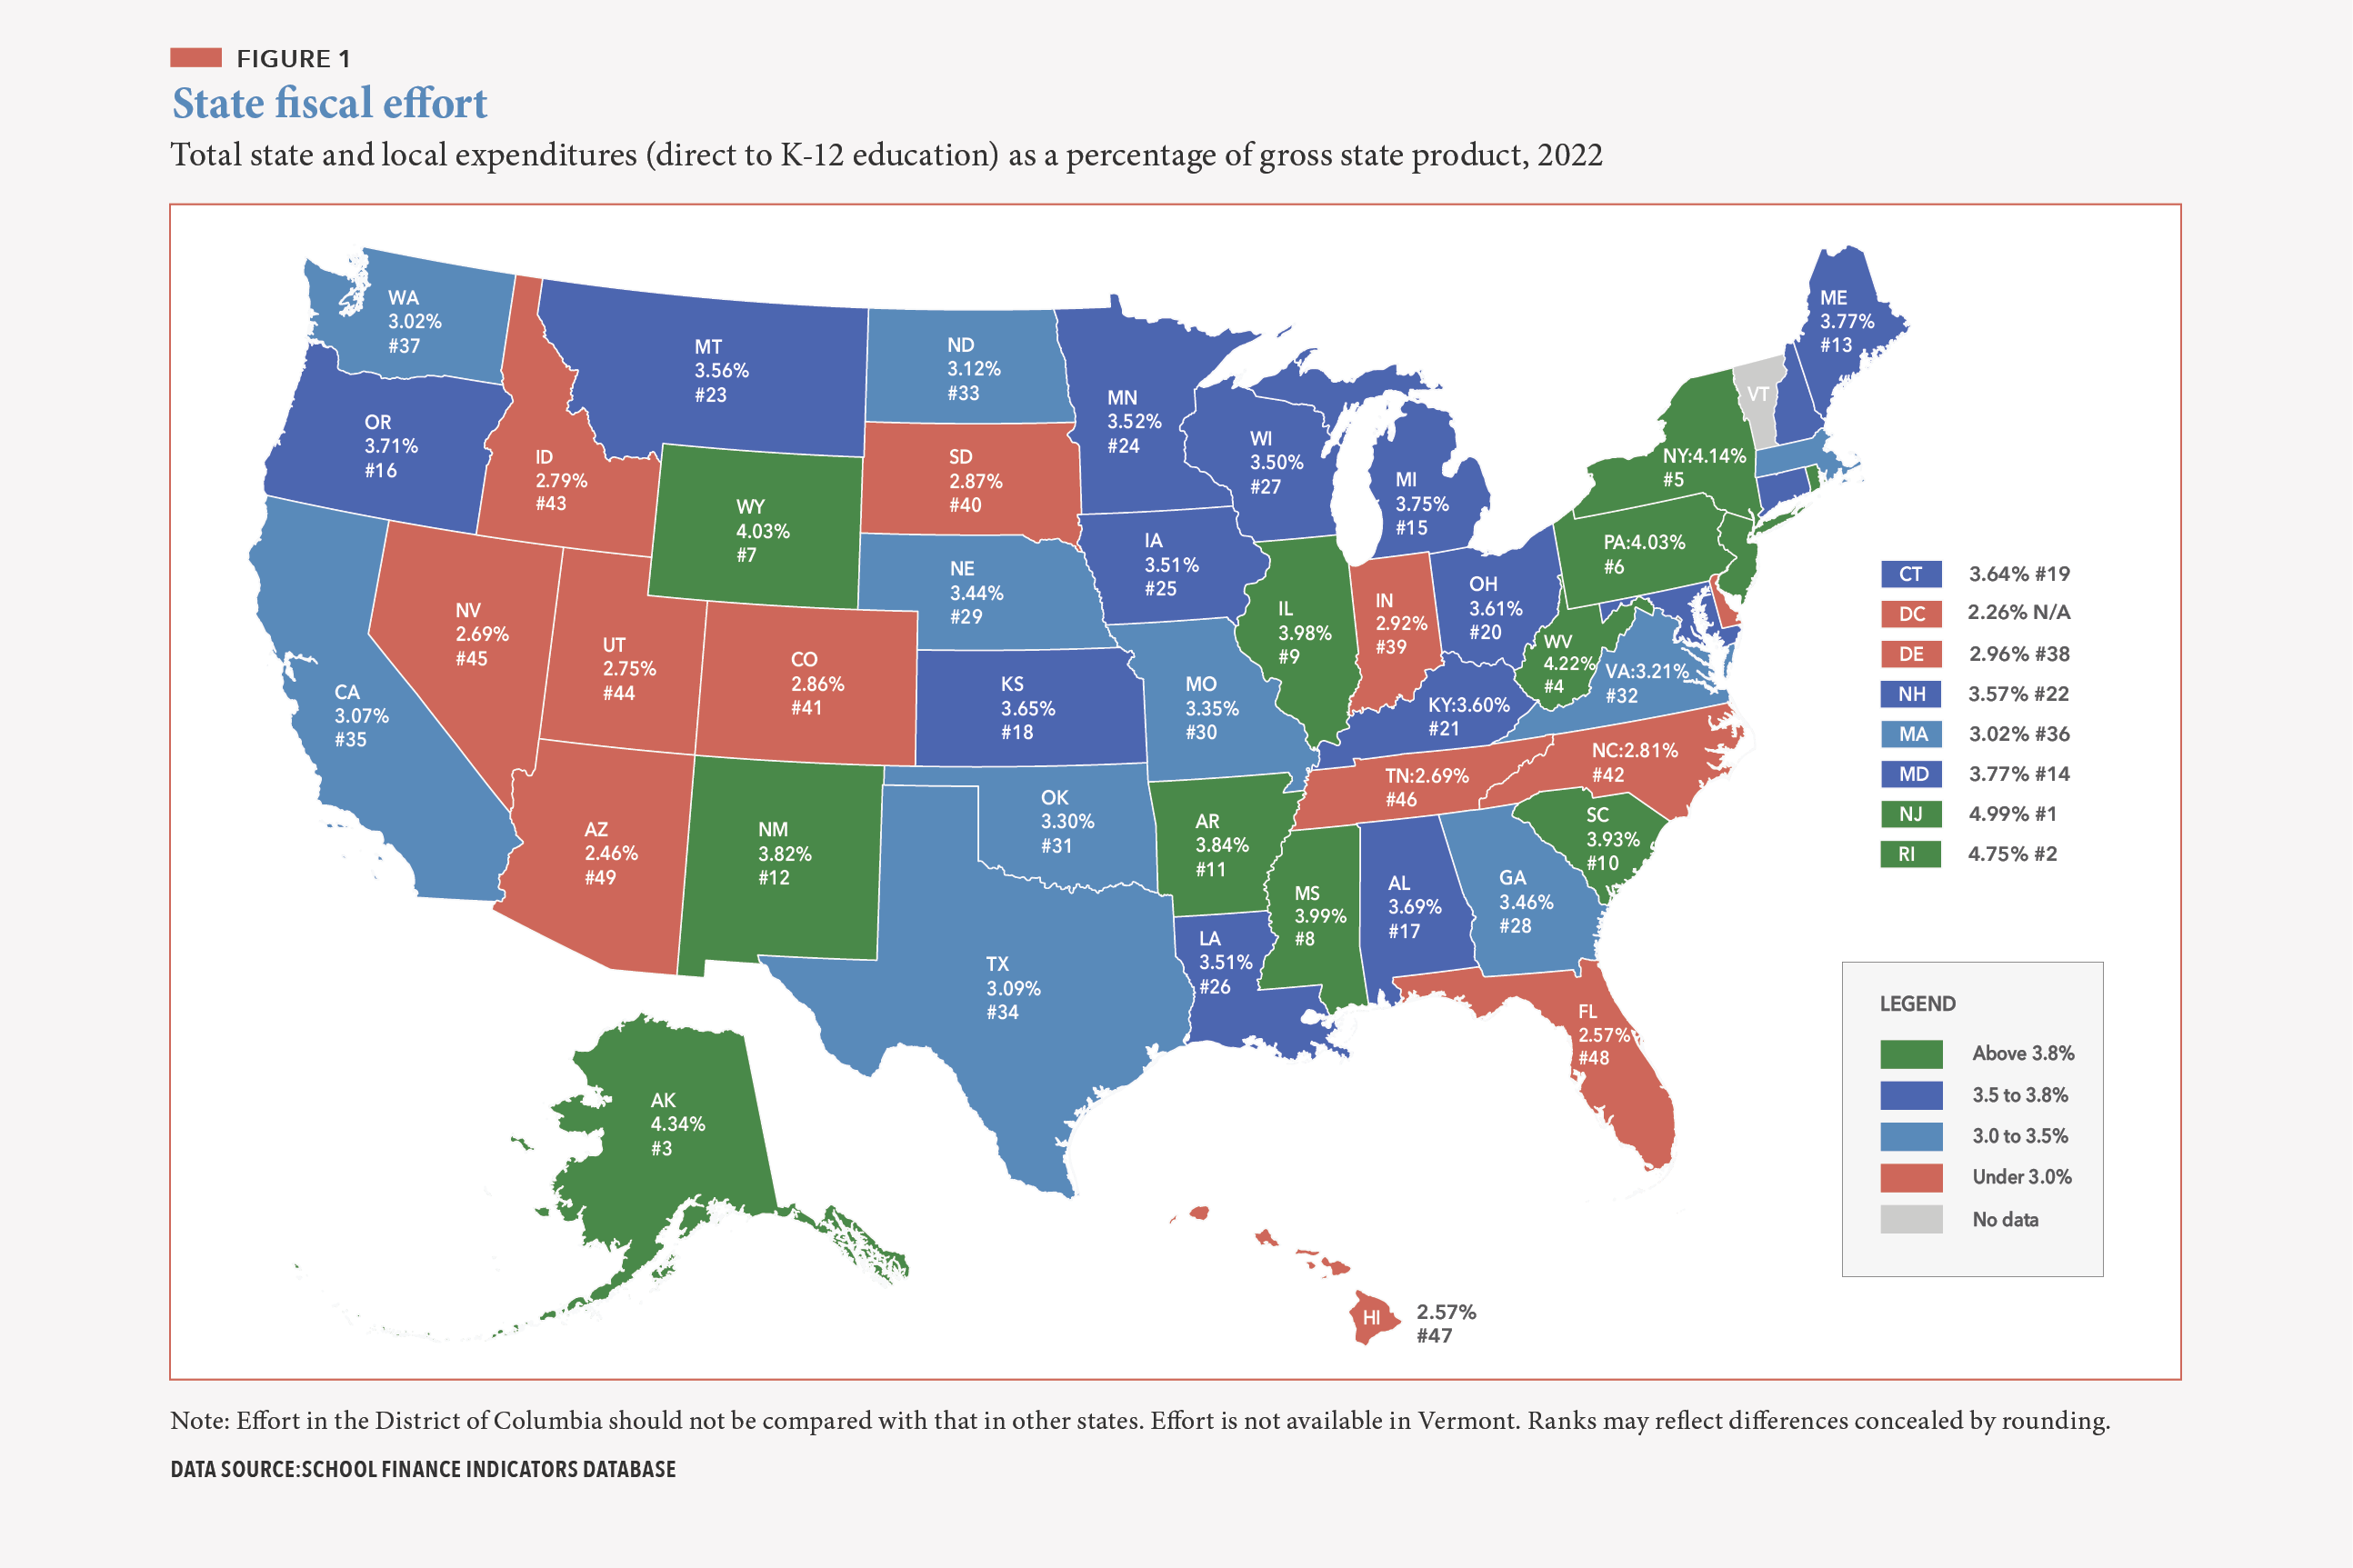
Accordingly, we use a national cost model to calculate adequate funding levels for the vast majority of the nation’s public school districts. We then use these estimates to evaluate each state—relative to other states or groups of states—based on the overall adequacy of funding across all its districts (statewide adequacy) as well as the degree to which its high-poverty districts are more or less adequately funded than its affluent districts (equal opportunity). Finally, because states vary in their ability to raise revenue (e.g., some states have larger economies than others), we also assess whether states are leveraging their capacity to fund schools by measuring total state and local spending as a percentage of states’ economies (fiscal effort).
These three “core indicators”—effort, statewide adequacy, and equal opportunity—offer a parsimonious overview of whether states’ systems are accomplishing their primary goal of providing adequate and equitable funding for all students. In this report, as well as the one-page state profiles that accompany the report, we present results on these three measures for each state.
Selected national findings
There are 41 states that devote a smaller share of their economies to their K-12 schools than they did before the 2007-09 recession. Had these states returned to their pre-recession effort levels by 2016, their funding would have been $480 billion higher between 2016 and 2022, which is roughly 10 percent of all state and local school funding during those seven years. [View graph: Effort by state]
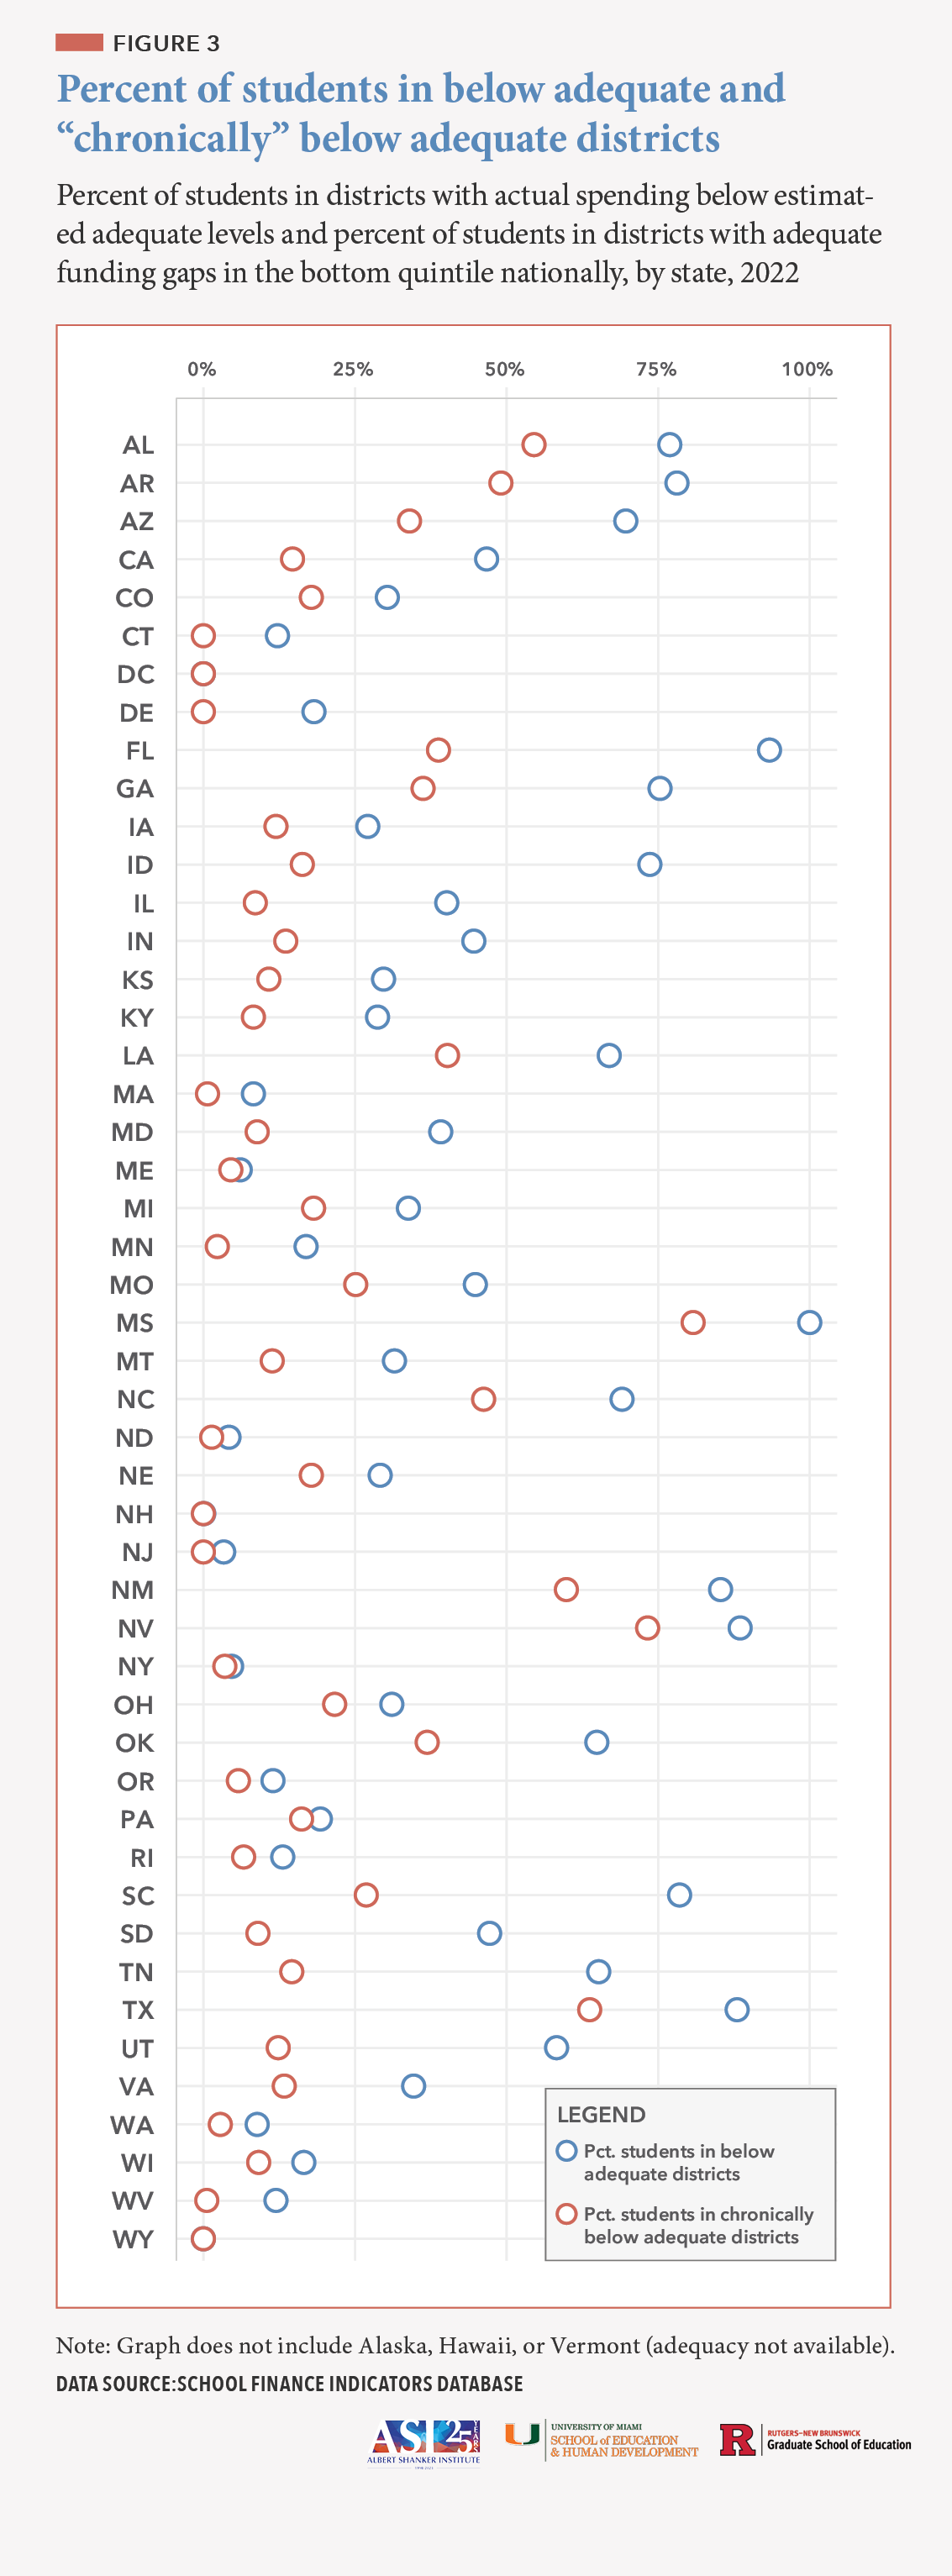
About 70 percent of the nation’s students that we identify as being in “chronically underfunded” districts—the 20 percent of districts with the most inadequate funding in the nation—are in just 12 states. These states (Alabama, Arkansas, Arizona, Florida, Georgia, Louisiana, Mississippi, Nevada, New Mexico, North Carolina, Oklahoma, and Texas) serve only 34 percent of the nation’s students. [View graph: adequacy by state]
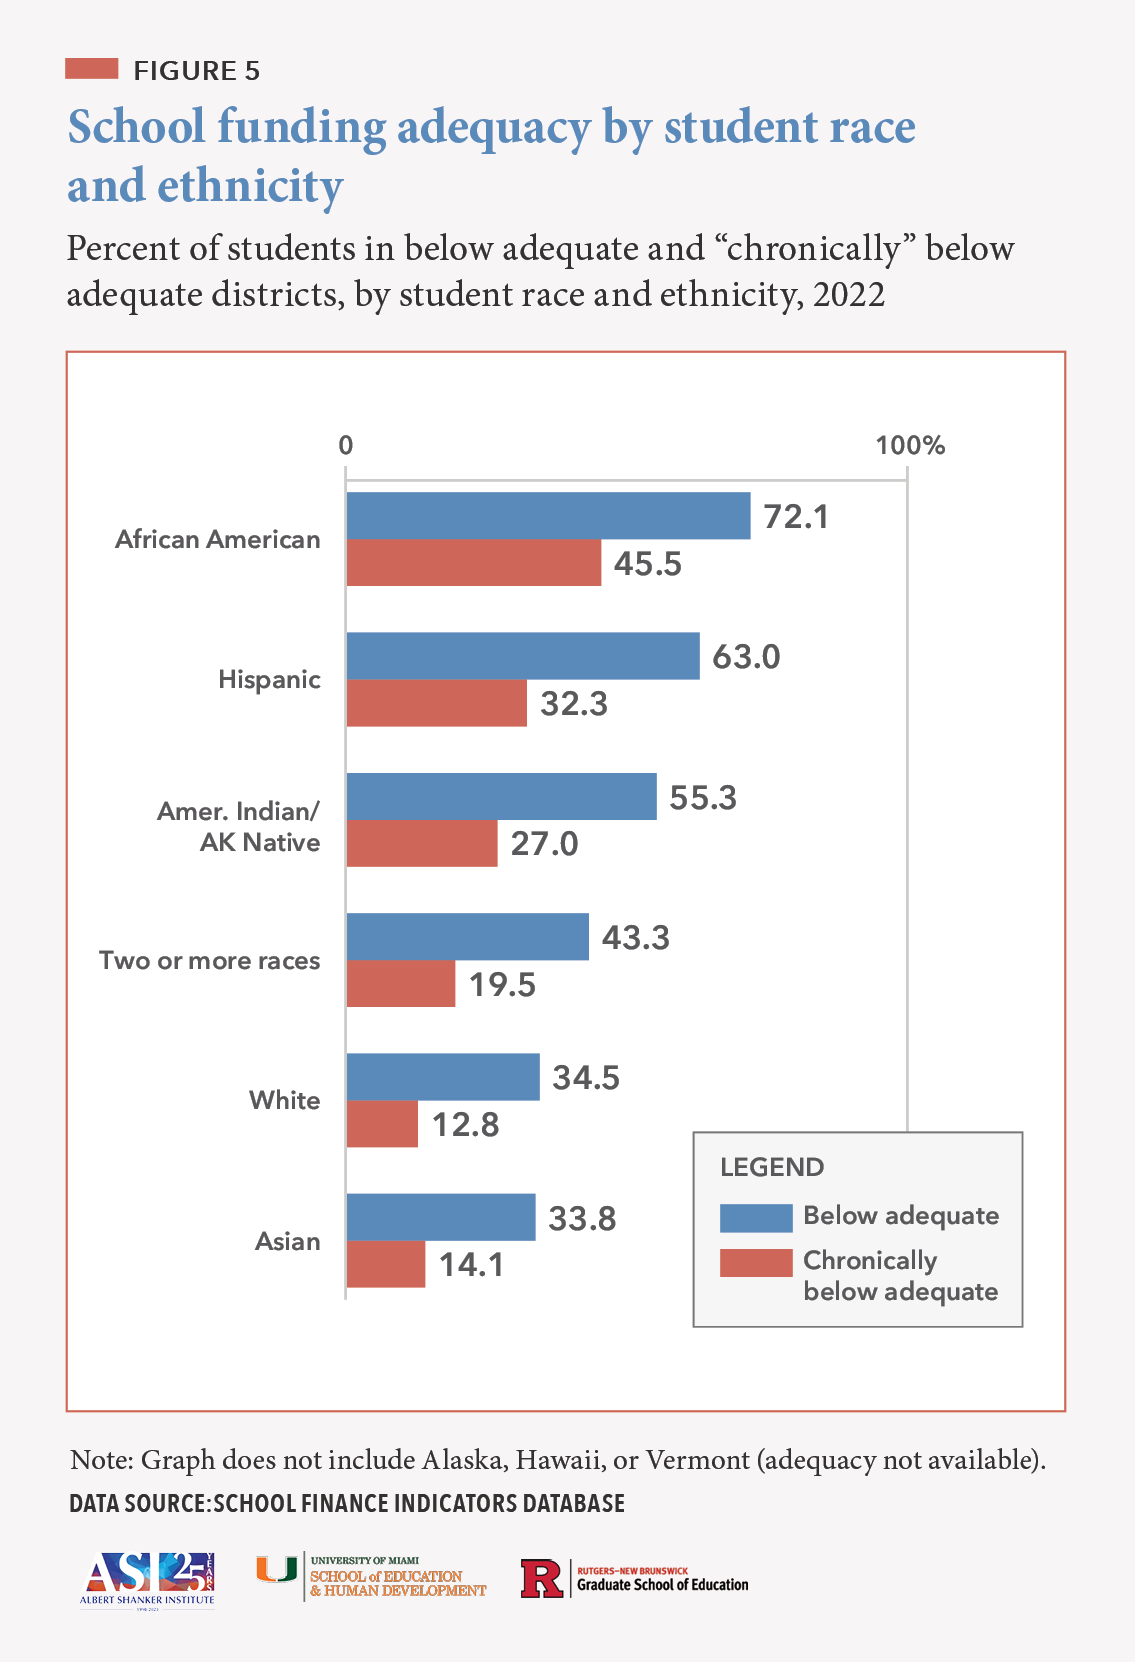
African American students are twice as likely as white students to be in districts with funding below estimated adequate levels, and 3.5 times more likely to be in “chronically underfunded” districts. The discrepancies between Hispanic and white students, as well as those between Native American and white students, are moderately smaller but still large. [View graph: adequacy by race]
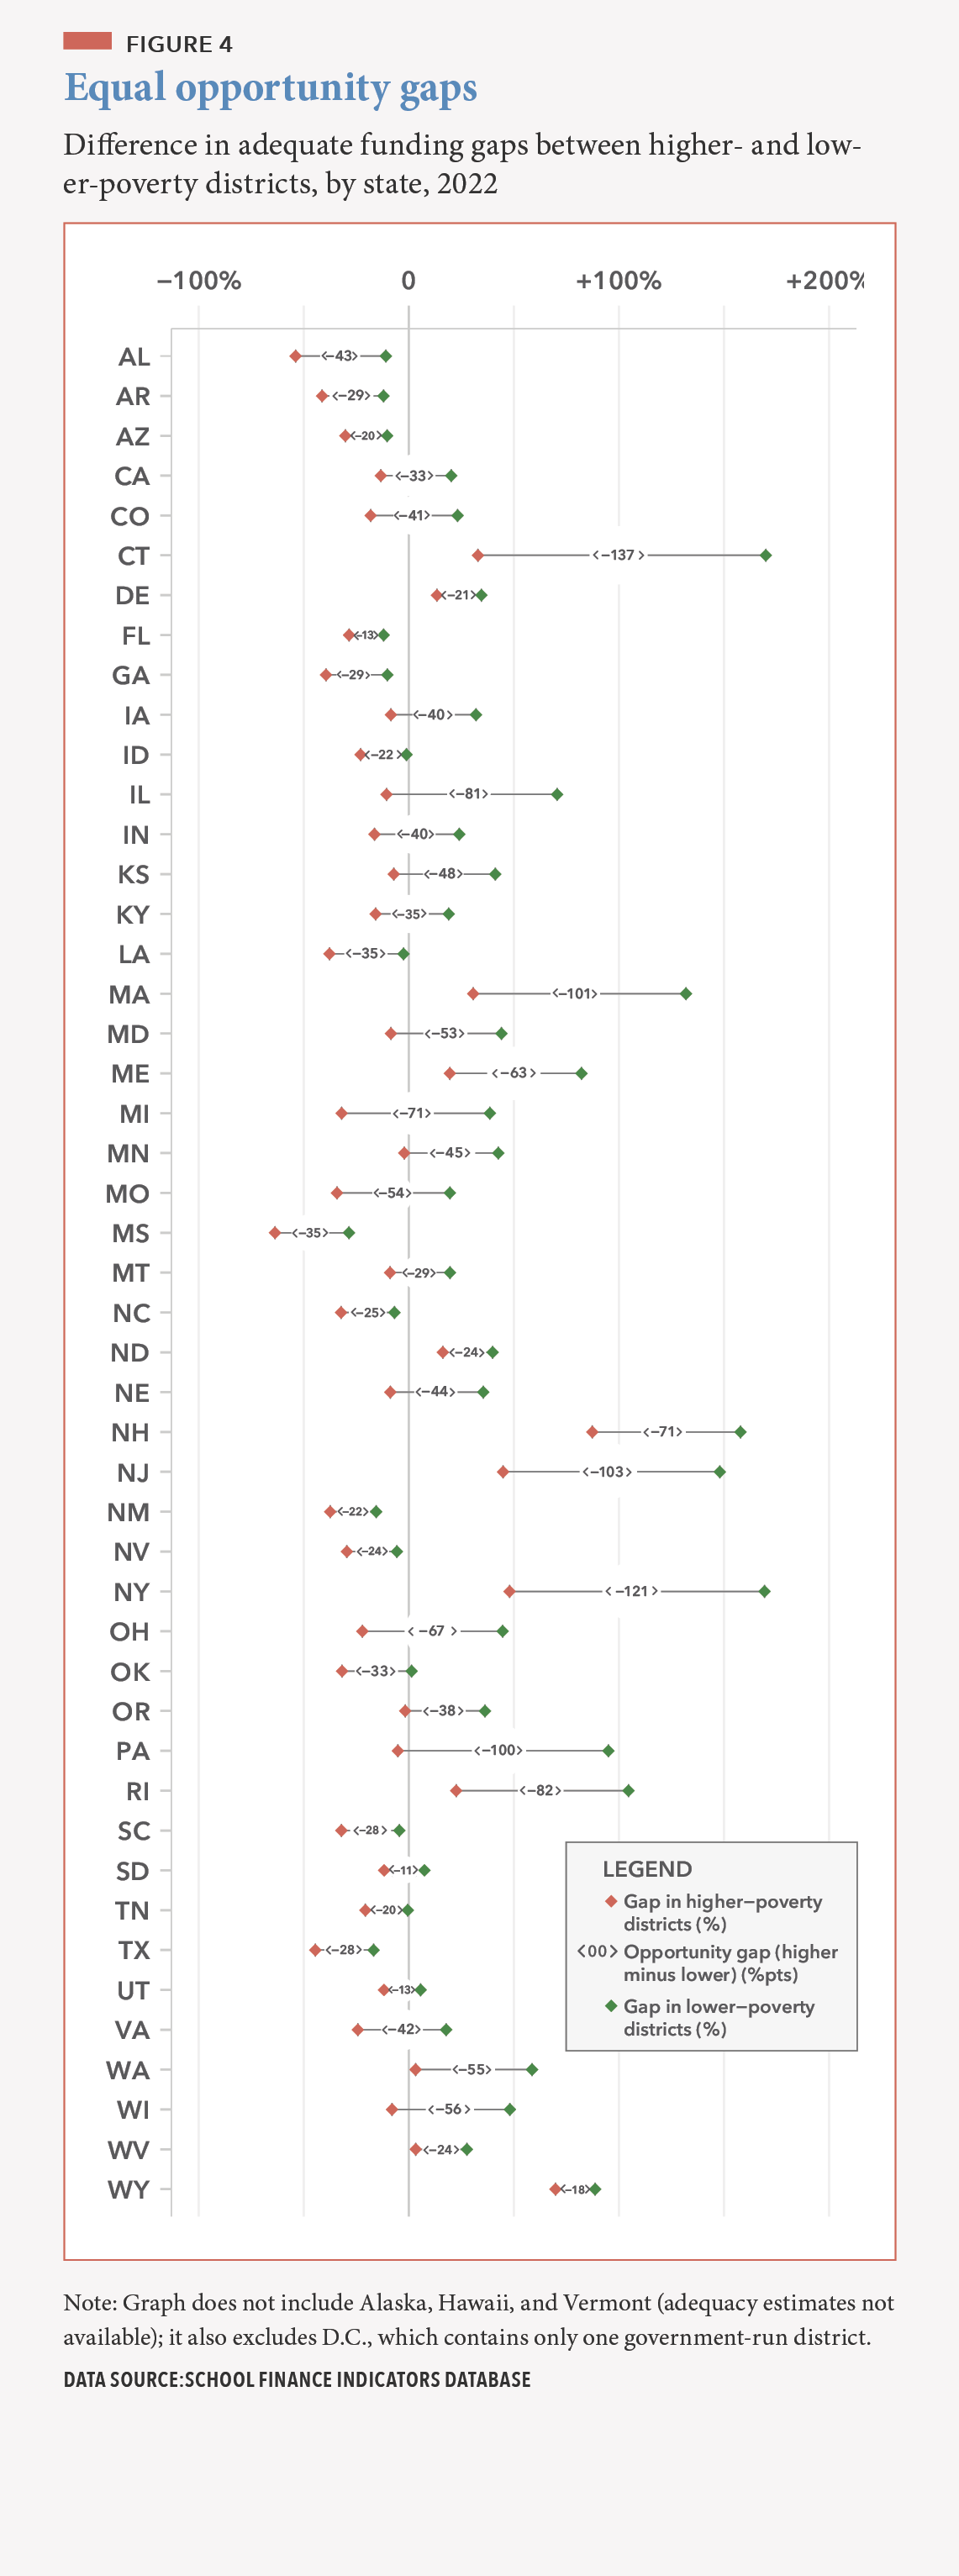
Educational opportunity is unequal in every state. The size of the gaps varies, but in every single state, higher-poverty districts are funded less adequately than lower-poverty districts. [View graph: equal opportunity by state]
Policy recommendations
Based on the results of this report, we conclude with a set of basic, research-backed principles that should guide the design and improvement of all states’ systems.
These policy recommendations include:
Better targeting of funding. If district funding levels are not determined rigorously by states, resources may appear adequate and equitable when they are not (and policymakers may not even realize it). All states should routinely “audit” their systems by commissioning studies to ensure that they are accounting for differences in the needs of the students served by each of their school districts.
Increase funding to meet student needs where such funding is inadequate. The point here is for states to ensure that funding is commensurate with costs/need. In some states, adequate and equitable funding might require only a relatively modest increase in total funding (particularly state aid) along with better targeting. In other states, particularly those in which funding is inadequate and effort is low, larger increases are needed, and may include both local and state revenue.
Enhance federal monitoring of school funding adequacy, equity, and efficiency. We propose that the U.S. Department of Education establish a national effort to analyze the adequacy and equity of states’ systems and provide guidance to states as to how they might improve the performance of those systems.
Our findings as a whole highlight the enormous heterogeneity of school funding, both within and between states. Such diversity is no accident. So long as school finance is primarily in the hands of states, the structure and performance of systems is likely to vary substantially between those states.
The upside of this heterogeneity is that it has allowed researchers to study how different systems produce different outcomes and, as a result, we generally know what a good system looks like. Our framework for evaluating states is based on these principles. It is our hope that the data presented in this report and accompanying resources will inform school finance debates in the U.S. and help to guide legislators toward improving their states’ systems.
Latest News
 UPDATED ANNUAL REPORT, PROFILES, AND DATASETS AVAILABLE
February 2026: Read the eighth edition of our annual report, view your state’s one-page finance profile, use our data visualizations, or download the full state-level dataset.
Latest Annual Report
 The Adequacy and Fairness of State School Finance Systems (8th edition)
The eighth edition of our annual report presenting findings on effort, statewide adequacy, and equal opportunity in state school finance systems. Published February 2026.
Latest Research Briefs
 State School Finance System Profiles (2022-23 school year)
One-page profiles summarizing the key results on effort, statewide adequacy, and equal opportunity for all 50 states and D.C. View your state’s profile. Published February 2026.


Copyright © 2022-2023 Albert Shanker Institute | All Rights Reserved