Brief: School Finance and Teacher Pay Competitiveness
The issue of teacher pay has become a popular topic in our national political discourse over the past few years. Low salaries have been cited as a primary cause of several statewide teacher strikes and demonstrations, and the issue has even featured in the current presidential campaign.
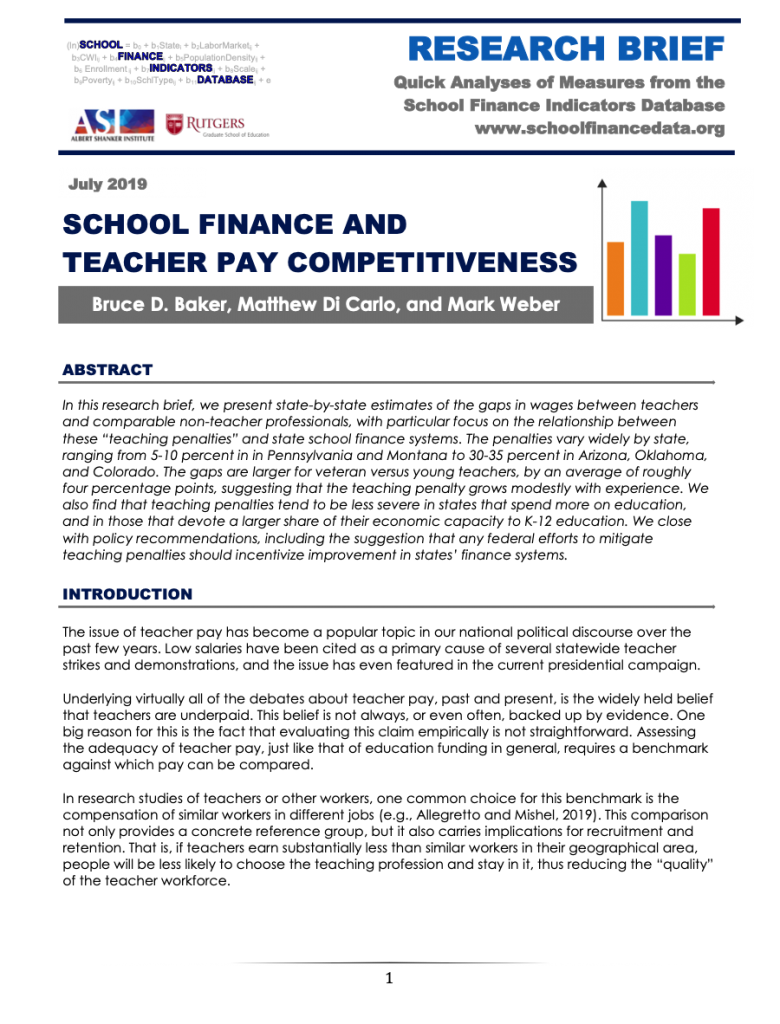
In this research brief, we present state-by-state estimates of the gaps in wages between teachers and comparable non-teacher professionals, with particular focus on the relationship between these “teaching penalties” and state school finance systems.
The penalties vary widely by state, ranging from 5-10 percent in in Pennsylvania and Montana to 30-35 percent in Arizona, Oklahoma, and Colorado. The gaps are larger for veteran versus young teachers, by an average of roughly four percentage points, suggesting that the teaching penalty grows modestly with experience.
We also find that teaching penalties tend to be less severe in states that spend more on education, and in those that devote a larger share of their economic capacity to K-12 education. We close with policy recommendations, including the suggestion that any federal efforts to mitigate teaching penalties should incentivize improvement in states’ finance systems.
Authors: Bruce D. Baker, Matthew Di Carlo, and Mark Weber
Read the full research brief
See detailed teacher competitiveness data for each state using our data visualization
Latest News
 UPDATED ANNUAL REPORT, PROFILES, AND DATASETS AVAILABLE
March 2025: Read the seventh edition of our annual report, view your state’s one-page finance profile, use our data visualizations, or download the full state- and district-level dataset.
Latest Annual Report
 The Adequacy and Fairness of State School Finance Systems (7th edition)
The seventh edition of our annual report presenting findings on effort, statewide adequacy, and equal opportunity in state school finance systems. Published March 2025.
Latest Research Briefs
 State School Finance System Profiles (2021-22 school year)
One-page profiles summarizing the key results on effort, statewide adequacy, and equal opportunity for all 50 states and D.C. View your state’s profile. Published March 2025.


