State School Finance Profiles
2017-18 School Year (published January 2021)
School funding is both enormously important and extremely complicated. Large amounts of finance data are collected every year by districts, states, and the federal government. These data are used produce volumes of reports and papers, which vary widely in terms of empirical rigor, often leading to conflicting conclusions. This can be frustrating for policymakers, parents, advocates, and other stakeholders.
The primary purpose of the School Finance Indicators Database (SFID) is to cut through this clutter. It is a collection of finance and resource allocation measures that is based on sophisticated and widely accepted methods, but is also designed to be easy for non-researchers to understand and use.
Each year, we publish an annual report summarizing key findings from the SFID. Although this report does present data from every state, it does not allow for the kind of state-specific detail that many users desire. Moreover, while all of our state indicators data are available to the public, analyzing datasets, as well as compiling and contextualizing results from a variety of different measures, can be difficult and time-consuming. These 51 one-page state profiles pull together a selection of key measures into one place and provide a succinct summary of each state’s (and D.C.’s) public K-12 finance system. They are published every year as an accompaniment to the annual report. These 2017-18 profiles were published as part of the 2021 annual report.
To download an individual state profile, use the drop down menu above. Or download the full set of 51 profiles.
It is important to note that the latest year of data presented in the state profiles is 2017-18, which means the data predate the coronavirus pandemic and accompanying economic recession. It will be a couple of years before we are able to publish the SFID data for a time period that reflects the impact of this crisis. In the meantime, however, it is crucial for policymakers and the public to examine and understand their school finance systems as they were prior to the pandemic. The features and performance of each state’s system will to no small extent determine the severity and duration of the current recession’s impact on its school budgets, as well as its ability to withstand future economic crises (see Baker and Di Carlo 2020).
Characterizing complex state finance systems parsimoniously is a challenge. The State Indicators Database (SID), which is the primary product of the SFID, includes approximately 130 variables measuring revenue and spending at different levels (e.g., federal, state, local), resource allocation (e.g., staff ratios, teacher pay), and other topics. The indicators are statistically adjusted for factors, such as regional wage variation and poverty, to allow for better comparisons within and between states (many of the indicators are available over the past 25-30 years).
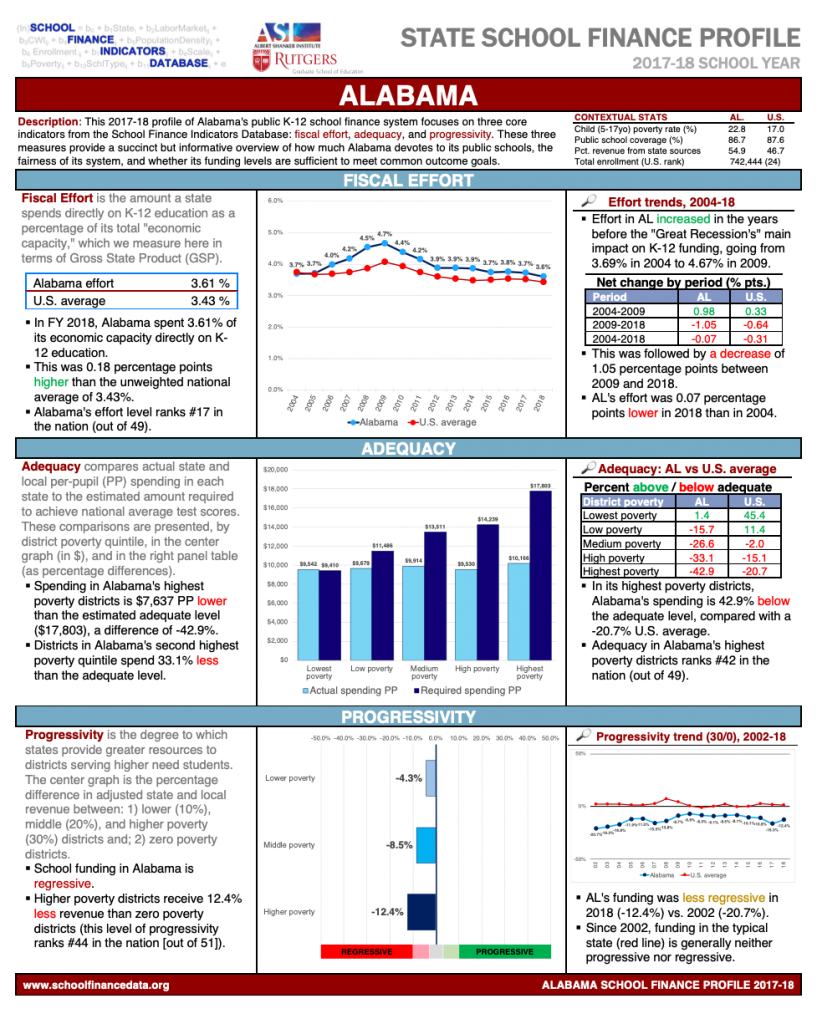
Any attempt to include all or even most of these measures in a single profile would likely overwhelm many users. It is also unnecessary. Instead, the profiles, like our annual report, focus on three “core” measures from the state database, which together offer an effective overview of the fairness and sufficiency of each state’s finance system:
- Effort: how much of a state’s total resources or capacity are spent directly on public K-12 education;
- Adequacy: whether states provide districts with resources sufficient to meet common outcome goals;
- Progressivity: whether states allocate more resources to districts serving larger proportions of disadvantaged children.
In the profiles, we provide descriptions of each of these three measures, and we try to present the data clearly and in context. This includes, for example, comparisons of each state with the nation as a whole, and, where possible, trends over time.
On the back of each profile (or on the second page of the individual state PDFs) you can find more detailed information about the indicators and notes about how they are presented and might be interpreted. This back page also lists the names of SID variables used, should readers wish to download and analyze the data for themselves. It is our hope that the profiles contribute to improving the quality and productivity of school finance debates and policymaking.
Authors: Bruce D. Baker (Rutgers University); Matthew Di Carlo (Albert Shanker Institute); Lauren Schneider (Albert Shanker Institute); Mark Weber (Rutgers University)
Previous versions: 2016-17 profiles
Latest News
 UPDATED ANNUAL REPORT, PROFILES, AND DATASETS AVAILABLE
February 2026: Read the eighth edition of our annual report, view your state’s one-page finance profile, use our data visualizations, or download the full state-level dataset.
Latest Annual Report
 The Adequacy and Fairness of State School Finance Systems (8th edition)
The eighth edition of our annual report presenting findings on effort, statewide adequacy, and equal opportunity in state school finance systems. Published February 2026.
Latest Research Briefs
 State School Finance System Profiles (2022-23 school year)
One-page profiles summarizing the key results on effort, statewide adequacy, and equal opportunity for all 50 states and D.C. View your state’s profile. Published February 2026.


Copyright © 2022-2023 Albert Shanker Institute | All Rights Reserved