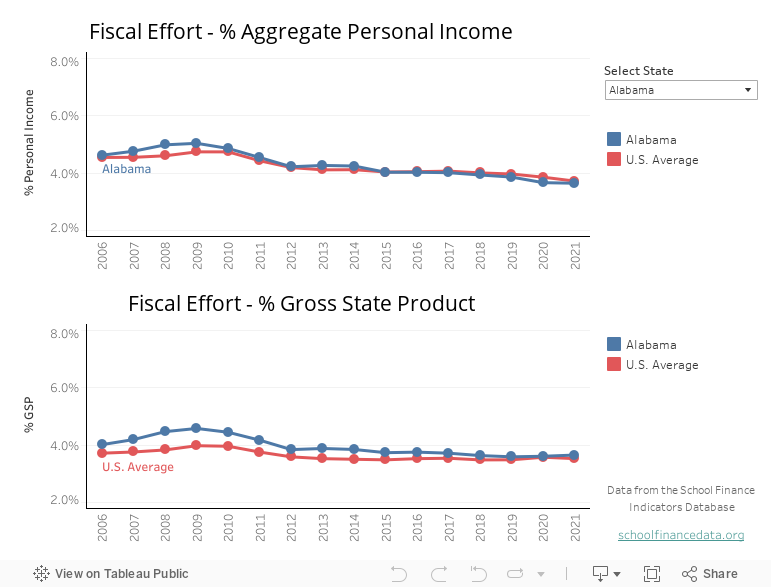
Visualization: State fiscal effort
Select a state to display trends in fiscal effort for that state and the U.S. average between 2006 and 2022. Fiscal effort measures states’ direct K-12 education spending as a percentage of their total economic capacity, or the size of their “economic pies.” The two graphs represent spending as a percentage of two different measures of states’ economic capacity (both effort measures are highly correlated). The U.S. average in both graphs is unweighted.
Note that fiscal effort is not calculated for Vermont between 2018-2022 due to irregularities in that state’s data. And effort in the District of Columbia (particularly GSP-based effort) should not be compared with that in other states. For more information on these measures, see our State Indicators Database user’s guide and our annual report. You can also download the full dataset.
Note: if you get an “unexpected error” message when attempting to load the Tableau visualization, try enabling third party cookies in your web browser.
Visualization by Lauren Schneider
Latest News
 UPDATED ANNUAL REPORT, PROFILES, AND DATASETS AVAILABLE
March 2025: Read the seventh edition of our annual report, view your state’s one-page finance profile, use our data visualizations, or download the full state- and district-level dataset.
Latest Annual Report
 The Adequacy and Fairness of State School Finance Systems (7th edition)
The seventh edition of our annual report presenting findings on effort, statewide adequacy, and equal opportunity in state school finance systems. Published March 2025.
Latest Research Briefs
 State School Finance System Profiles (2021-22 school year)
One-page profiles summarizing the key results on effort, statewide adequacy, and equal opportunity for all 50 states and D.C. View your state’s profile. Published March 2025.


Copyright © 2022-2023 Albert Shanker Institute | All Rights Reserved