
The links below direct to different data visualizations, all of which present data from either our State Indicators Database or District Cost Database. The visualizations are all updated annually with the latest data, and they are divided into three categories:
- One-page state profiles: view one-page PDF summaries of each state’s system
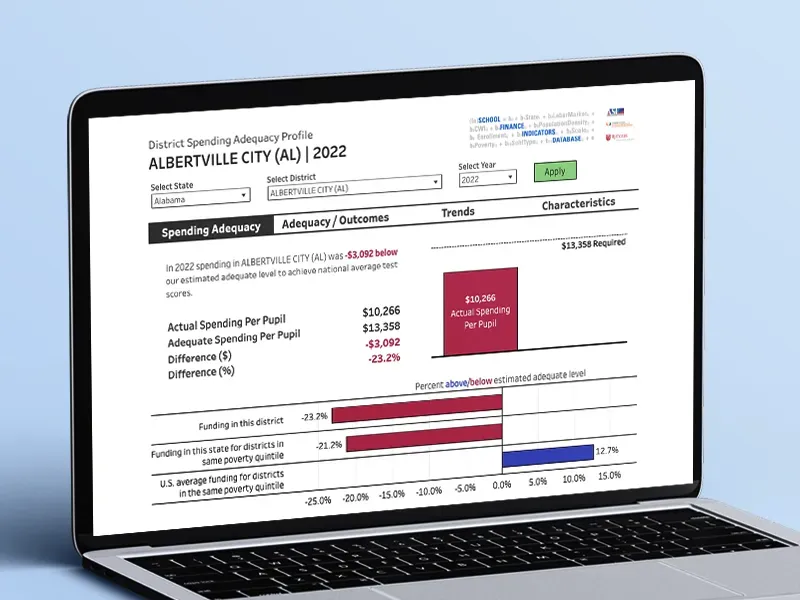
- District visualization: display adequacy estimates for over 12,000 individual school districts
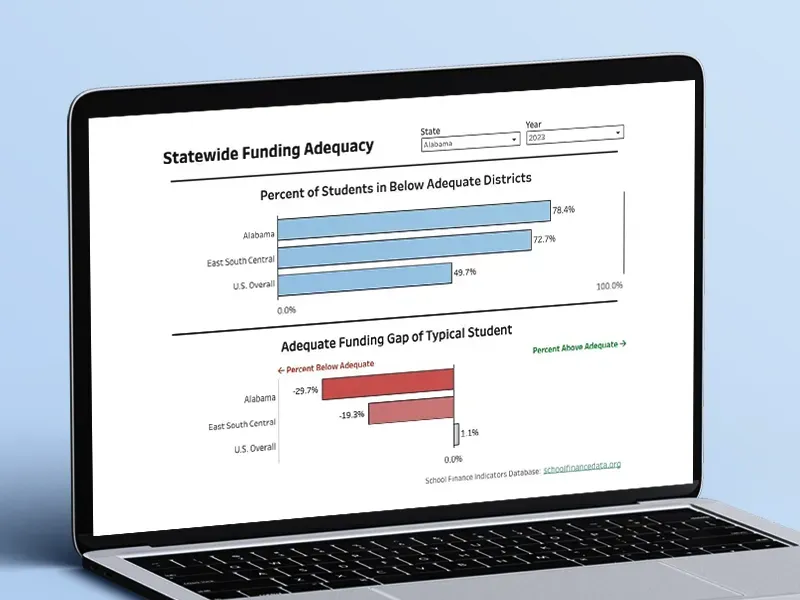
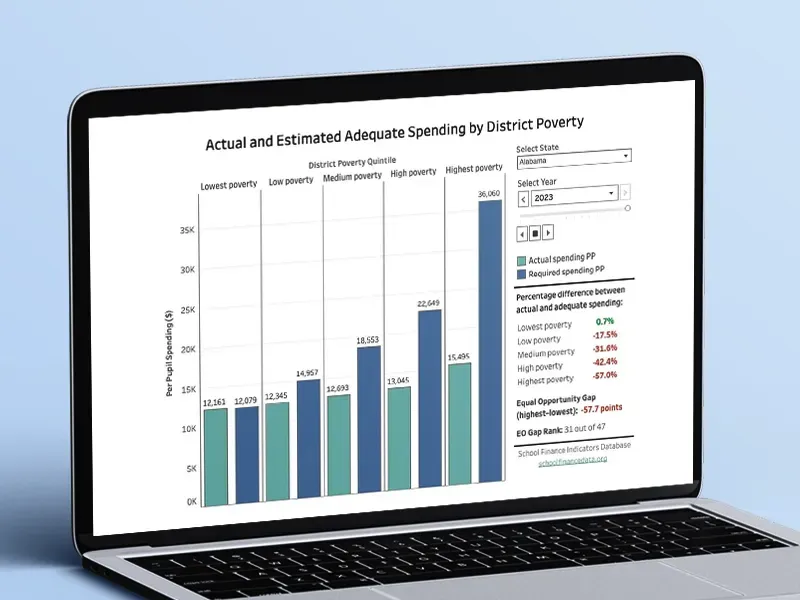
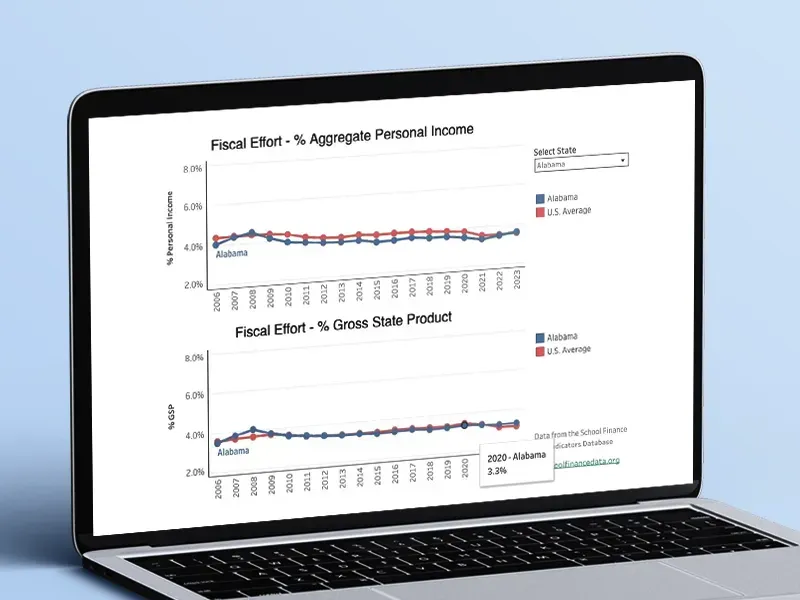
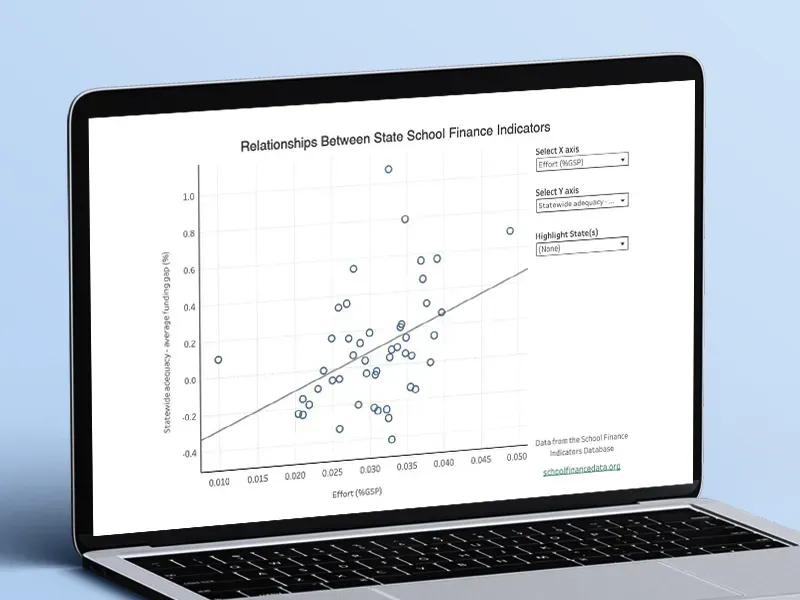
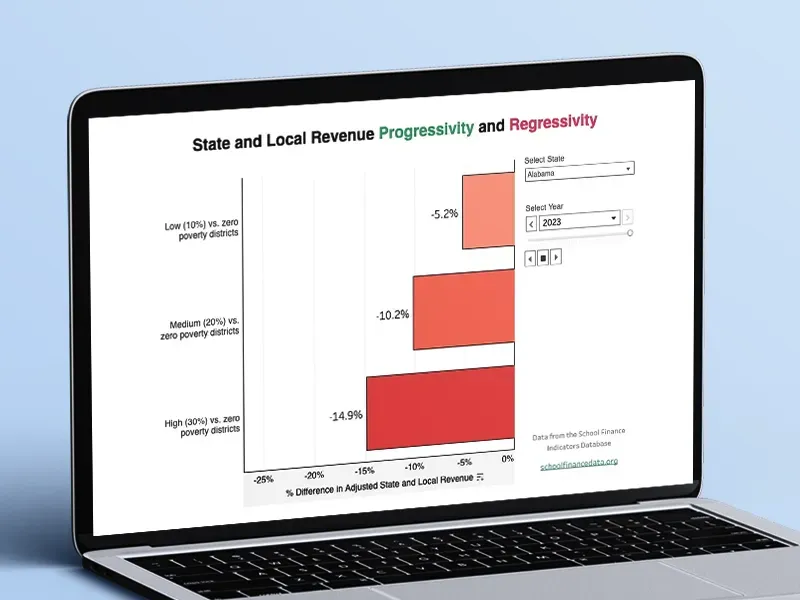
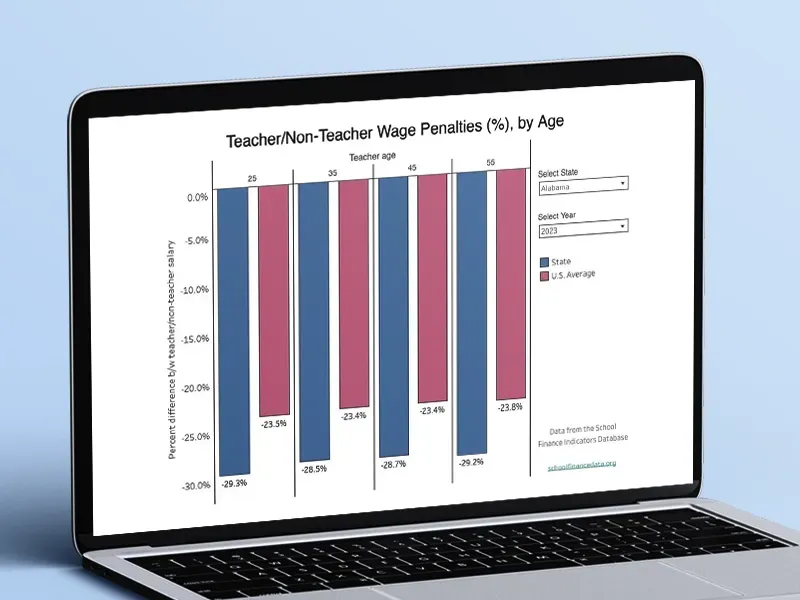
- State visualizations: display individual states’ estimates for a selection of measures
Additional information about each visualization can be found on its webpage. You can also download the full datasets in Excel or Stata format.