The Adequacy and Fairness of State School Finance Systems
Second Edition (February 2020)
When it comes to American education, few policy areas are as misunderstood — or as crucial — as school finance. Over the past several years, a political and empirical consensus has emerged about the importance of equitable and adequate school funding for high quality K-12 education. In other words, the evidence is clear that money does, indeed, matter.
Certainly, debates about how education funds should be spent are also important, and money should be spent wisely. But there are few options for improving America’s schools that don’t require adequate and sustained investment, particularly for disadvantaged students. And while maintaining efficiency is important, the fact is that districts cannot spend money wisely that they do not have.
In this report, we present key findings from the second release of our School Finance Indicators Database (SFID), a public database of sophisticated but user-friendly state school finance measures going back to 1993. This latest version of the SFID includes data up to 2017 (the 2016-17 school year).
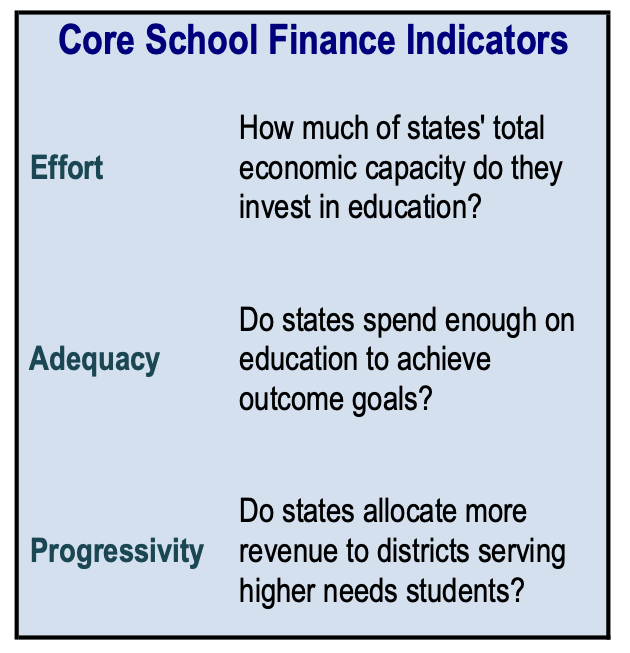
The database includes approximately 130 variables, but in this report we focus on three key school finance measures: effort, adequacy, and progressivity. As a whole, we feel that these three measures provide a succinct and informative overview of the adequacy and fairness of states’ school finance systems.
Our indicators are most appropriately interpreted on a state-by-state basis, but in this report we do attempt to present some calculations of national averages and trends in those averages. A summary of our key findings on our “core indicators” is as follows:
Effort
Effort (or fiscal effort) measures how much of states’ total economic resources or capacity are spent directly on K-12 education. States with smaller economic capacity must exert greater effort than states with greater capacity to raise the same amount of revenue for their schools. Our measures allow us to determine whether states lag behind in spending because they don’t have the capacity to raise revenue (e.g., they have smaller economies from which to draw tax revenue), or because they refuse to devote sufficient resources to education.
- The typical state devotes about 3.5 percent of its capacity (i.e., Gross State Product) to K-12 education. Individual states’ effort levels range from about 2.4 percent in Nevada to over 5 percent in Vermont.
- Other higher effort states include Wyoming (4.7), New Jersey (4.6), New York (4.5), and Alaska (4.5). Other lower effort states include Arizona (2.6), North Carolina (2.7), Delaware (2.8), and Tennessee (2.8). Most states, however, are within 0.5 percentage points of the national average (though even small differences can translate into large amounts of revenue, particularly in states with large economies).
- The U.S. average effort increased from 3.7 percent in 2004 to a high of 4.1 percent in 2009. This was followed by a five year decline between 2009 and 2014, stabilizing at roughly 3.5 percent since then. In fact, between 2009 and 2017, fiscal effort decreased at least nominally in every single state except Wyoming. Overall, then, average effort has not rebounded since the Great Recession, and is slightly lower in 2017 than it was in 2004.
Adequacy
While effort measures how hard states and districts work to raise funds for their public schools, adequacy measures address whether the amount raised is enough. Our primary measure of adequacy compares current education spending, by district poverty quintile, to spending levels that would be required to achieve national average test scores. In other words, we define adequacy in terms of a common “benchmark” (national average scores) that is educationally meaningful, using estimates from complex models that take into account factors such as student characteristics, labor market costs, and district characteristics.
- On average, spending on the highest poverty districts (80-100th percentile poverty) is approximately 70 percent of estimated adequate levels. That is, the typical state spends 30 percent less than it would need to for students in its highest poverty districts to achieve nationally average test scores.
- There are only six states in which spending on the highest poverty districts exceeds estimated adequate levels: Wyoming; Delaware; New Hampshire; Nebraska; Connecticut; and New York. Conversely, current spending on these highest poverty districts is less than half of the adequate level in five states: Arizona; New Mexico; California; Texas; and Mississippi.
- Nationally, the situation is not much better in the second highest poverty districts (60-80th percentile district poverty), where spending is, on average, about 78 percent of required amounts. In contrast, spending is above our estimated adequate levels for the lowest poverty (0-20th percentile) and slightly higher in the second lowest poverty (20-40th percentile) districts.
- In general, states are spending enough on their lower poverty districts and not enough on their higher poverty districts (and their testing outcomes generally reflect this pattern).
- There is a relationship between fiscal effort and adequacy — that is, states that spend more of their “economic pie” on education tend to exhibit more adequate spending levels. Of particular concern are states, such as Arizona, that spend inadequately and put forth low effort, as well as states, such as Mississippi, that fail to achieve adequate funding levels despite putting forth relatively high effort levels.
Progressivity
Put simply, progressive funding systems are those in which higher poverty districts, all else being equal, receive more revenue than lower poverty districts. Regressive funding systems, in contrast, allocate more revenue to wealthier districts than they do to poorer districts. Progressivity (sometimes called “fairness”) is important because it is generally acknowledged that students from disadvantaged backgrounds tend to require more resources than their more affluent peers to achieve the same level of educational outcomes. Our primary progressivity measure controls for factors — such as poverty, labor market costs, population density, and district size — that affect the value of the education dollar. These controls allow us to compare district and state school revenues in a way that accounts for differences that are largely outside the control of education policymakers.
- A handful of states, such as Wyoming, Alaska, and Utah, allocate revenue in a strongly progressive manner, whereas funding is highly regressive in Illinois and Nevada.
- There are only ten states in which high poverty districts receive at least 10 percent more revenue than zero poverty districts. In 28 states, high poverty districts actually receive less revenue. In other words, the vast majority of states’ finance systems fund their high and low poverty districts either similarly or regressively.
- Accordingly, on average, state and local education funding in the U.S. is neither progressive nor regressive. That is, the highest poverty districts in the typical state tend to receive similar amounts of revenue, all else being equal, as do the lowest poverty districts.
- U.S. average progressivity has increased very modestly over the past two decades, going from minimally regressive in 1997 (revenue in the highest poverty districts was 3-4 percent lower than in the lowest poverty districts) to minimally progressive in 2017 (revenue was about two percent higher in the highest poverty districts compared with the lowest poverty districts). At the national level, education funding has been non-progressive for the past two decades.
Overall, then, our findings indicate that there are several states in which education funds are both adequate and distributed equitably. In general, however, resources in most states tend to be allocated regressively or non-progressively, and funding for higher poverty districts in the vast majority of states falls far short of estimated adequacy levels (in many cases reflecting a lack of effort).
We do not provide state rankings or grades in this report, as the interplay between effort, adequacy and progressivity is far too complex to be boiled down to such simple measures. We do, however, include recommendations as to how researchers, policymakers, and the public can use our findings, as well as our database, to evaluate state systems and inform debates about improving school finance in the U.S.
Authors: Bruce D. Baker (Rutgers University); Matthew Di Carlo (Albert Shanker Institute); and Mark Weber (Rutgers University)
Download the full report
Download the press release
Download the full dataset or use data visualizations
Previous editions of the report: First edition (2019)
Latest News
 UPDATED ANNUAL REPORT, PROFILES, AND DATASETS AVAILABLE
February 2026: Read the eighth edition of our annual report, view your state’s one-page finance profile, use our data visualizations, or download the full state-level dataset.
Latest Annual Report
 The Adequacy and Fairness of State School Finance Systems (8th edition)
The eighth edition of our annual report presenting findings on effort, statewide adequacy, and equal opportunity in state school finance systems. Published February 2026.
Latest Research Briefs
 State School Finance System Profiles (2022-23 school year)
One-page profiles summarizing the key results on effort, statewide adequacy, and equal opportunity for all 50 states and D.C. View your state’s profile. Published February 2026.


Copyright © 2022-2023 Albert Shanker Institute | All Rights Reserved